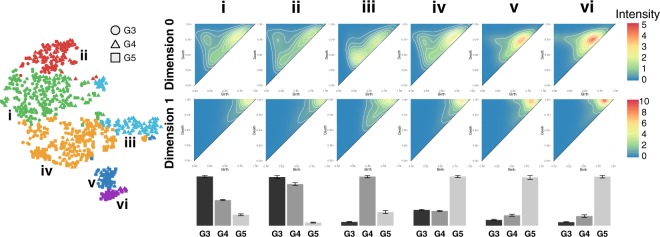
Figure 5.
A continuum of homology features correspond to an architectural progression from Gleason 3 to Gleason 5. t-SNE dimensionality reduction with corresponding Ward hierarchical clustering is shown for an example bootstrap, selected by finding the bootstrap with the minimal Euclidean distance between the six clusters of the bootstrap and the six medoid’s of the meta-clusters. Circles, triangles, and squares correspond to purely graded ROI’s of Gleason 3, 4, and 5, respectively. Each column is labeled with a histogram indicating the relative distribution of purely graded Gleason 3, 4, and 5 ROIs for each meta-cluster centroid, with error bars indicating standard error for the clusters within each meta-cluster. Average intensity diagrams for the medoid of each meta-cluster are shown in numbered columns with each number corresponding to a cluster of the example bootstrap with the same label. The top row of intensity diagrams correspond to zero-dimensional homology features (connected components) and the bottom row of intensity diagrams correspond to one-dimensional homology features (cycles).

