Figure 8.
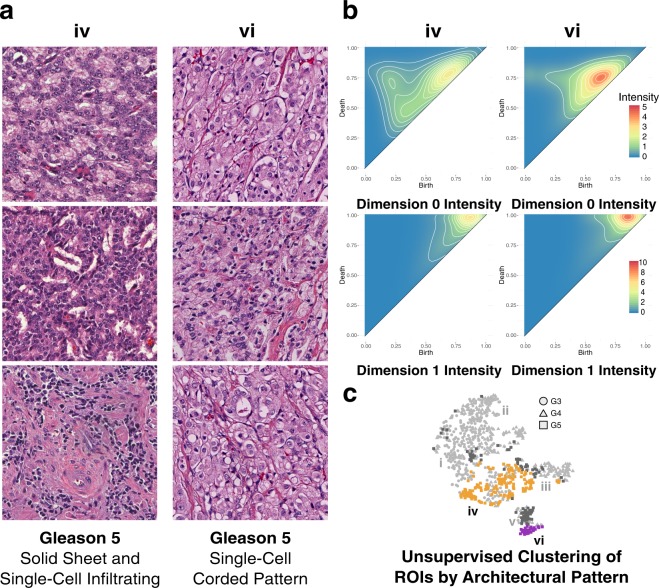
Persistent homology differentiates Gleason 5 solid sheet and single cell infiltrating pattern from single cell corded pattern. (a) Representative Gleason 5 ROIs from orange cluster iv comprising solid sheet pattern ROIs, and purple cluster vi comprising single cell pattern ROIs. (b) Zero-dimensional and one-dimensional persistence intensity diagrams, for cluster iv and vi respectively, with intensity values ranging 0 to 5 for zero-dimensional diagrams, and 0 to 10 for one-dimensional diagrams, as indicated by the included legend. (c) Hierarchical Ward clustering results of first six principle components, with t-SNE dimensionality reduction for visualization, with unique clusters indicated by color, and Gleason pattern indicated by shape (Gleason 3: circle; Gleason 4: triangle; Gleason 5: square). Relevant clusters iv (orange) and vi (purple) are labeled accordingly. Light grey points correspond to Gleason 3 and Gleason 4 points present in all clusters, but not considered in this figure. Dark grey points correspond to Gleason 5 points present in clusters other than the two being considered in this figure.

