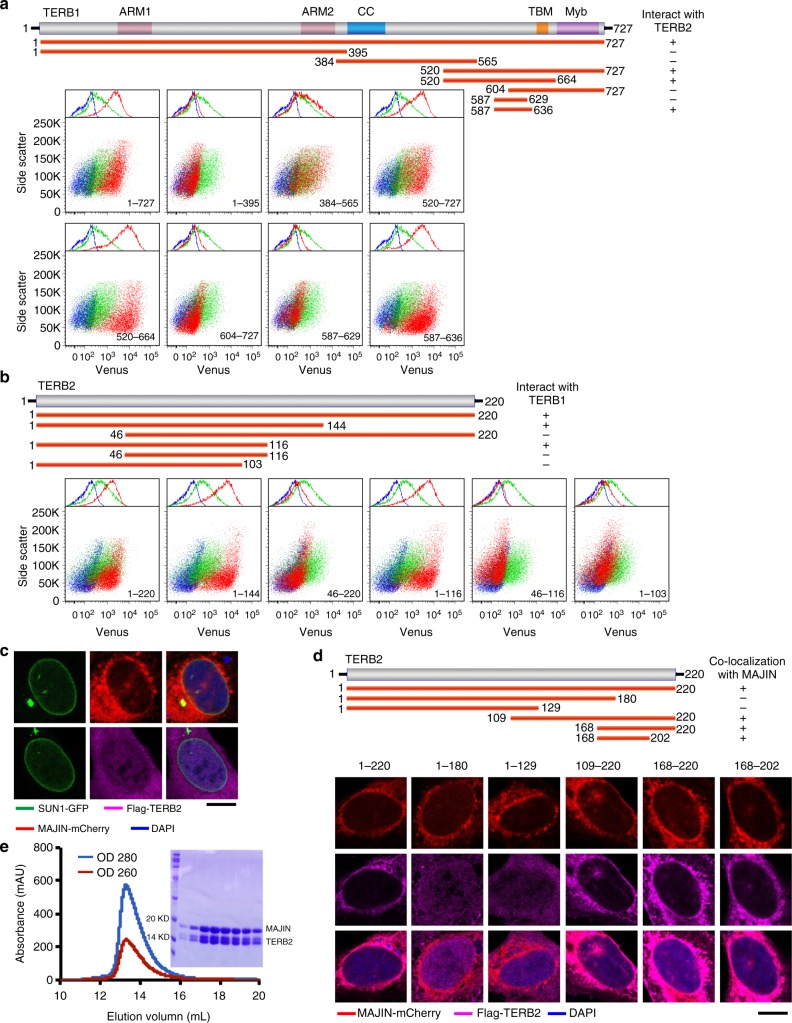
Fig. 1.
Characterization of the interactions among TERB1, TERB2, and MAJIN. a Illustration of different fragments of TERB1 (upper panel). Bimolecular fluorescence complementation (BiFC) data with full-length TERB2 and varies TERB1 fragments (lower panel). Cells expressing TERB2-VC only (blue, as a negative control) or TERB2-VC with -VN vector (green, as a negative control) or TERB2-VC with different TERB1-VN fragments (red) were subjected to fluorescence-activated cell sorting (FACS) analysis. b Illustration of various fragments of TERB2 (upper panel). BiFC data with full-length TERB1 and TERB2 fragments (lower panel). Cells expressing TERB1-VC only (blue, as a negative control) or TERB1-VC with -VN vector (green, as a negative control) or TERB1-VC with different TERB2-VN truncations (red) were subjected to FACS analysis. c Equator images of U-2 OS cells expressing SUN1-GFP (green) together with mCherry-MAJIN (red) (up) or Flag-TERB2 (magenta) (down). SUN1-GFP was used to indicate the nuclear envelope localization. Cells were stained with 4,6-diamidino-2-phenylindole (DAPI; blue) to show the nuclear position. Scale bars, 10 μm. d Schematics of various TERB2 fragments (upper panel). Equator images of U-2 OS cells expressing mCherry-MAJIN (red) and Flag-TERB2 truncations. Cells were stained with Flag antibody (magenta) and DAPI (blue). Scale bars, 10 μm. e Gel filtration chromatography profile of the TERB2MBM–MAJINNTD complex. Sodium dodecyl sulfate-polyacrylamide gel electrophoresis image of the peak in the gel filtration chromatography profile is shown

