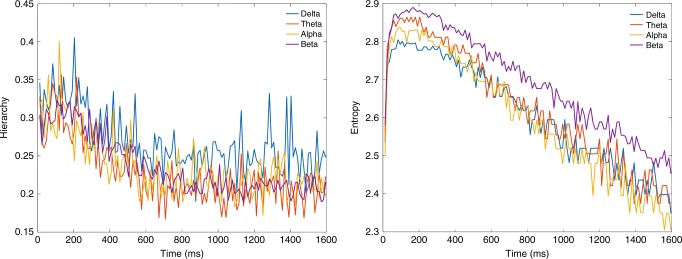
Fig. 7.
Timescale in MEG data. Figure shows the results of using hierarchy (left) and entropy (right) on the different delta (1–4 Hz), theta (4–8 Hz), alpha (8–12 Hz) and beta (12–30 Hz) bands of the MEG data in different bin sizes from 10 to 1600 ms, i.e. directly on the empirical data—and thus not using the whole-brain modelling part of the process used for fMRI data. The peaks in entropy and hierarchy for all bands show a peak in the region of around 200 ms, which is similar to the peak found in fMRI and thus suggest a similar richness of the dynamical repertoire

