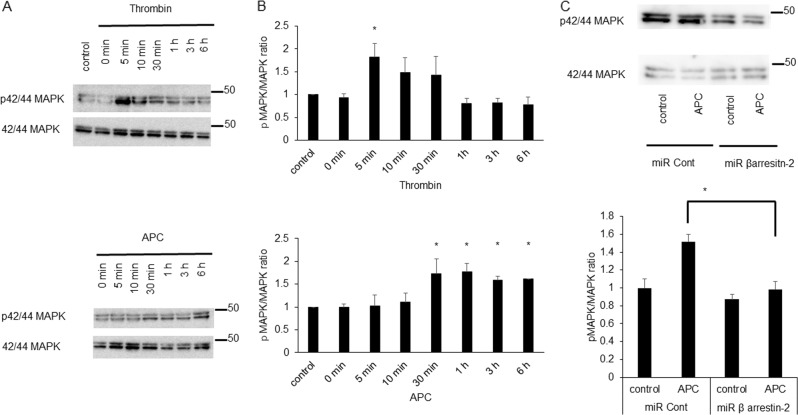
Fig. 3. The temporal profiles of MAPK 42/44 phosphorylation by thrombin or APC with time.
a Upper panel showed western blot analysis of phosphorylation of MAPK 42/44 under the treatment with thrombin 0.5 U/mL and lower panel showed under the treatment with APC 1.0 ng/mL. b Quantitative results of western blot analysis of the treatment with thrombin (upper panel) and APC (lower panel). Results are means ± SEM (n = 4). *p < 0.05 compared with the HUVECs under no treatment by Mann–Whitney U-tests. c Upper panel showed western blot analysis using β-arrestin-2 knockdown cells (miR βarrestin-2) or control cells (miR Cont) under no treatment or treatment with APC 1.0 ng/mL. Lower panel showed quantitative results of western blot analysis using β-arrestin-2 knockdown cells (miR β arrestin-2) (n = 4) compared with control cells (miR Cont) (n = 4) under treatment with APC. Results are means ± SEM (n = 4). Data were analyzed compared with multiple groups by Kruskal–Wallis tests. *p < 0.05 compared with control cells under treatment of APC

