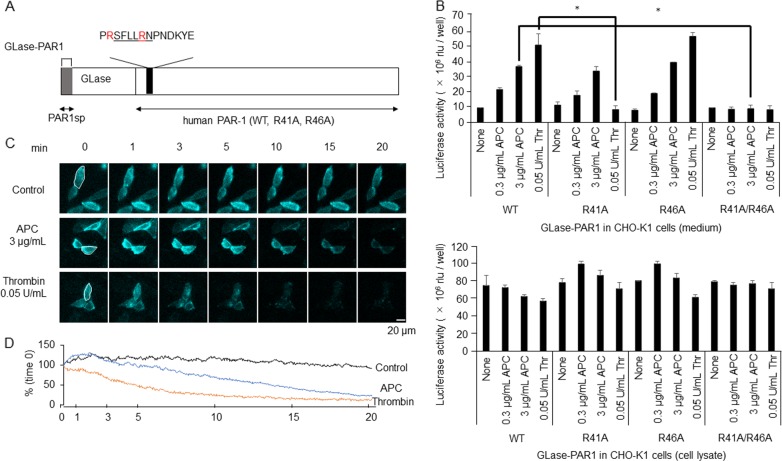
Fig. 4. Quantitative bioluminescence analyses of PAR-1 cleavage activities by APC and thrombin in living cells using GLase-PAR1 as a reporter protein.
a Schematic representation of a fusion protein of Gaussia luciferase and human PAR-1 (GLase-PAR1; also see Supplementary Fig. 4). The amino acid sequence of SFLLRN (underlined) is the tethered-ligand sequence. R41 and R46 residues in the human PAR-1 sequence are red-colored. When GLase-PAR1 expressed on the surface of living cells was cleaved by APC or thrombin, GLase was expected to be released from the cells; the luminescence activity of GLase in the culture medium and on the cell-surface were expected to increase and decrease, respectively. b Luminescence activities of the culture medium and cell lysate of CHO-K1 cells transiently expressing GLase-PAR1 and EPCR were determined by a luminometer. Cells transiently transfected with the expression vectors of GLase-PAR1 (R41/R46 wild-type or R41A-, R46A-, or R41A/R46A-double mutants) and EPCR were incubated for 30–60 min in HBSS containing 0.01% BSA with APC (0.3–3 µg/mL) or thrombin (0.05 U/mL). Luminescence activities in the culture medium and the cell lysate were determined by a Centro XS3 LB960 luminometer. Luminescence activity per well was expressed as the mean values ± S.D. (n = 8, *p < 0.05 compared with all multiple groups by Kruskal–Wallis tests). c, d Bioluminescence imaging analysis of GLase-PAR1 cleaved by APC and thrombin on the surface of living CHO-K1 cells. Based on the luminescence reaction of GLase and a luciferin (coelenterazine; 1 µg/mL), proteins on the cell surface were visualized at 2 s/frame using a microscopic system equipped with a water-cooled EM-CCD camera. Under these imaging conditions, the time-dependent decay in GLase activity was very slow and continuously visualized for 20 min after the start of recording. CHO-K1 cells transiently transfected for 48 h with the expression vectors of GLase-PAR1 and EPCR were washed with HBSS and pre-incubated for 10 min in the presence of coelenterazine. After incubation with APC (3 µg/mL) or thrombin (0.05 U/mL) for 10 s, luminescence signals of GLase-PAR1 were recorded for 20 min with an exposure time of 2 s. The luminescence images of GLase-PAR1 on the cell-surface (colored cyan) at 0, 1, 3, 5, 10, 15, and 20 min were shown. Scale bar was 20 µm. d Luminescence intensities of video image in a cell area (white circle in c) were calculated. Error bars represent ±SD (n = 8–10)

