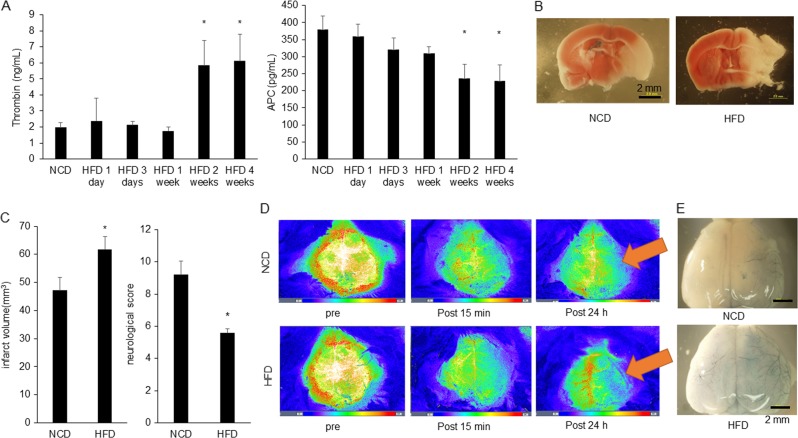
Fig. 7. HFD feeding mice show larger infarct volume and more severe neurological score than NCD mice.
a ELISA analysis of thrombin and APC at HFD mice or NCD mice were shown. Left panel showed quantitative results of thrombin concentration (n = 5–7). Results are means ± SEM. *p < 0.05 compared with NCD mice by Mann–Whitney U-tests. Right panel showed quantitative results of APC concentration (n = 8–10). Results are means ± SEM. *p < 0.05 compared with NCD mice by Mann–Whitney U-tests. b Representative TTC staining after MCAO of HFD feeding mice and NCD mice. Scale bar was 2 mm. c Left panel showed of infarct volume of NCD mice and HFD mice (NCD, 47.2 ± 4.6 mm3, n = 5; HFD, 61.8 ± 4.5 mm3, n = 5; p < 0.05 by Mann–Whitney U-tests). Results are means ± SEM. Right panel showed neurological score of NCD mice and HFD mice (NCD, 9.2 ± 0.4, n = 5; HFD, 5.6 ± 0.1, n = 5; p < 0.05 by Mann–Whitney U-tests). Results are means ± SEM. d Representative blood flow images of transient MCAO at pre-operation, after 15 min and after 24 h from MCAO using Omagazone. Upper panel showed blood flow of NCD feeding and lower panel showed blood flow of HFD feeding mice. Scale bar was 2 mm. e Representative image of transient MCAO brain after Evans Blue injection intravenously from tail vein. Scale bar was 2 mm

