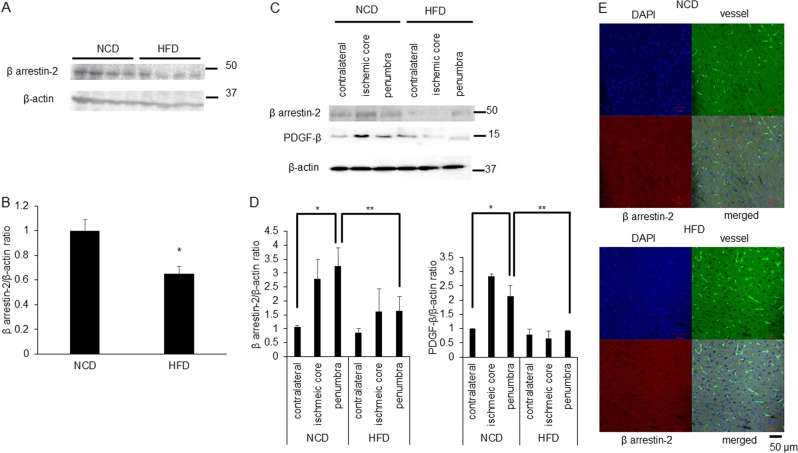
Fig. 8. β arrestin-2 and PDGF-β are less expression level at penumbra lesion in HFD mice compared with normal control diet (NCD) mice.
a This panel showed western blot analysis of β-arrestin-2 and β-actin at HFD mice compared with NCD mice under no treatment. b Quantitative results. β-arrestin-2/β-actin ratio compared with NCD mice were shown (NCD mice 1.0 ± 0.09; HFD mice 0.65 ± 0.06, n = 4) and results are means ± SEM. *p < 0.05 compared with NCD mice by Mann–Whitney U-tests. c This panel showed western blot analysis of β-arrestin-2, PDGF-β and β-actin at contralateral lesion, ischemic core lesion and penumbra lesion after 48 h from transient MCAO. d Quantitative results. β-arrestin-2/β-actin ratio and PDGF-β/β-actin ratio compared with contralateral lesion of NCD mice after 48 h MCAO of NCD and HFD feeding mice were shown. Results are means ± SEM (n = 4). Data were analyzed compared with all multiple groups by Kruskal–Wallis tests. *p < 0.05. f Representative image of immunostaining in the brains at penumbra lesion of MCAO mice. The nucleus appears blue due to DNA staining with DAPI and vessel appears green with fluorescence and β-arrestin-2 appears red. Scale bar was 50 µm

