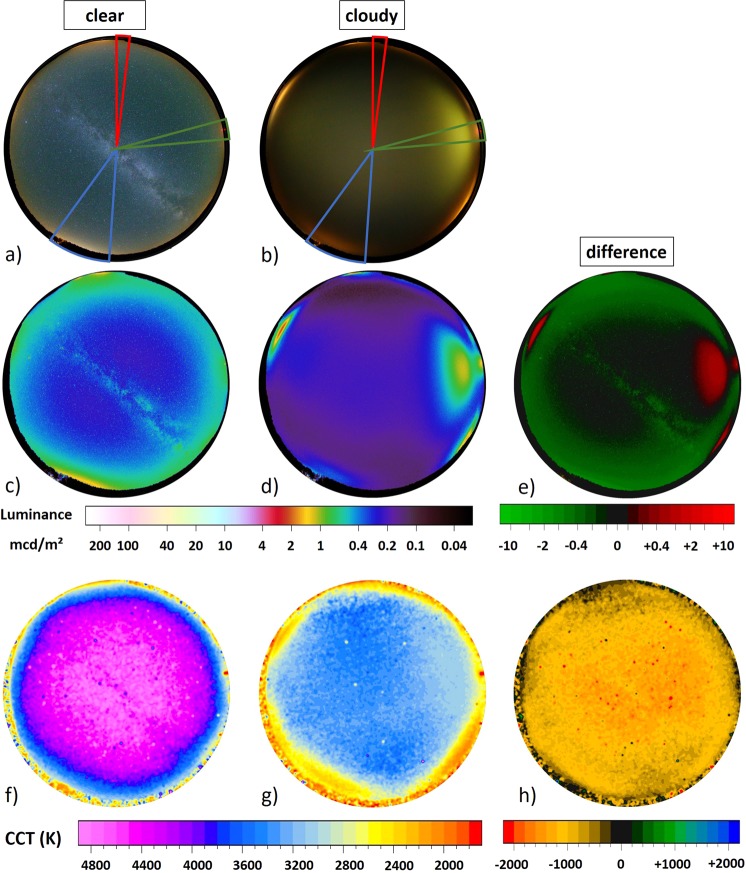
Figure 1.
Imaging data for LakeLab, Lake Stechlin Germany. The upper row (a,b) shows all-sky RGB images for (a) a clear sky on August 11th 2016 at 01:29 local time and (b) an overcast sky on August 12th 2016 at 01:27 local time local time. The colored segments are analyzed in more detail in subsection Fig. 2. The middle row (c–e) shows all-sky luminance maps calculated from the RGB images for (c) a clear night and (d) an overcast night. The right hand luminance map (e) shows the difference between the two nights obtained from subtracting images. The lower row (f–h) shows all-sky CCT maps calculated from for (f) a clear night and (g) an overcast night. The right hand CCT map (h) shows the difference between the two nights obtained from subtracting clear night data from the cloudy night data.

