
Figure 4.
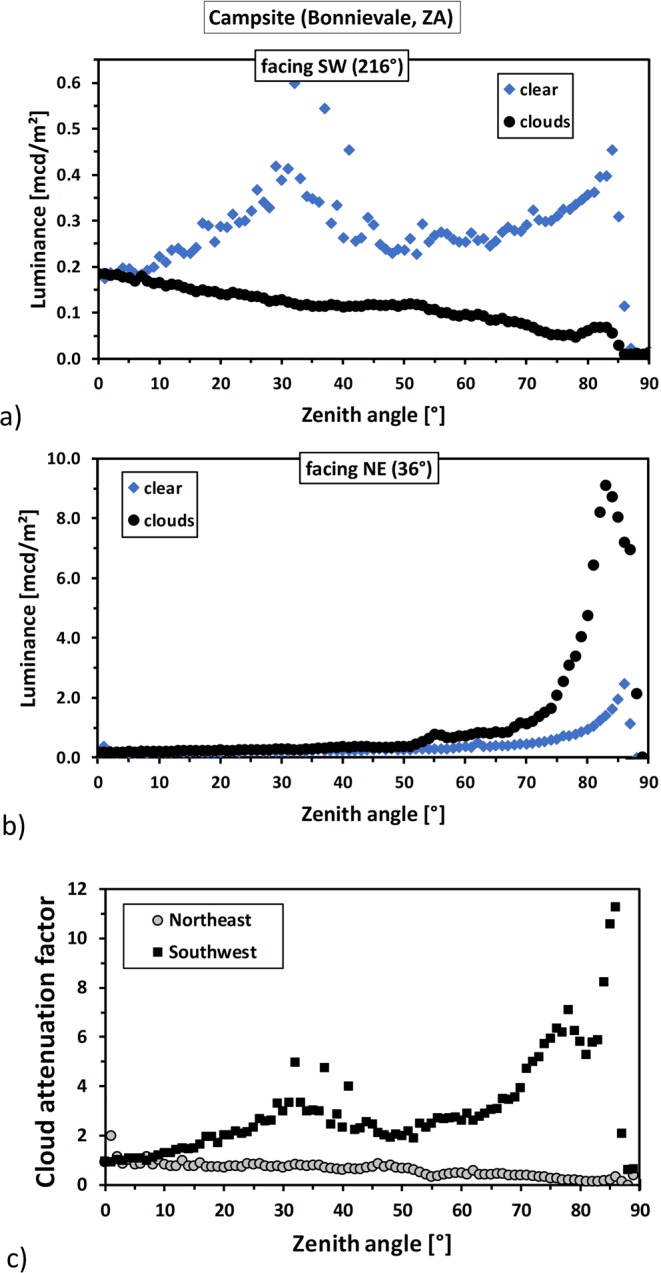
The two upper graphs (a) and (b) show the angular luminance distribution measured near Bonnievale, South Africa, for (a), the sky segment facing the southwest (red area in Fig. 3) and for (b) the sky segment facing the northeast (blue area in Fig. 3). Each graph shows clear night (blue diamonds) and overcast night (black circles) data. The variability slightly off zenith in the clear sky data originates from bright stars. Note the large difference in scale between the two upper graphs. The lower graph shows the cloud attenuation factor, for the two selected sky segments. Grey circles represent the north-eastern segment and black squares the sky segment facing the south-west.