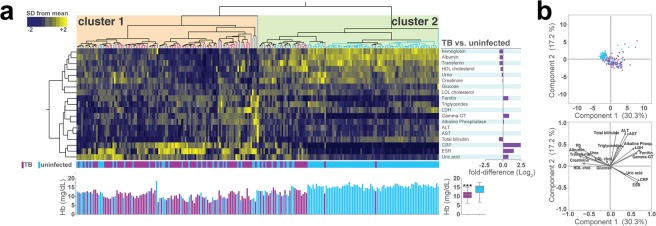
Figure 1.
Pulmonary TB patients display a unique profile of circulating biochemical parameters of inflammation. (a) Upper panel: A hierarchical clustering analysis (Ward’s method) was employed to illustrate the overall profile of inflammatory parameters in pulmonary TB patients or healthy controls. Each column represents one patient. Fold differences (TB vs. healthy controls) were calculated and statistically significant differences are highlighted in purple. Lower panel: Histogram for individual values of hemoglobin (Hb). Distributions of Hb were compared between TB patients and healthy controls using the Mann-Whitney U test. ***p < 0.0001. (b) A principal component analysis (PCA) model was employed to test whether combination of the markers evaluated could cluster TB patients separately from controls. A vector analysis was utilized to illustrate the influence of each biochemical parameter in the distribution of the data of the PCA model. Markers in red indicate those with the highest fold-difference values between TB and healthy controls. Abbreviations: ALP, alkaline phosphatase; ALT, alanine transaminase; AST, aspartate aminotransferase; Gamma-GT, gamma-glutamyl transferase; HDL, high-density lipoprotein; LDH, lactate dehydrogenase; LDL, low-density lipoprotein; VLDL, very-low-density lipoprotein.

