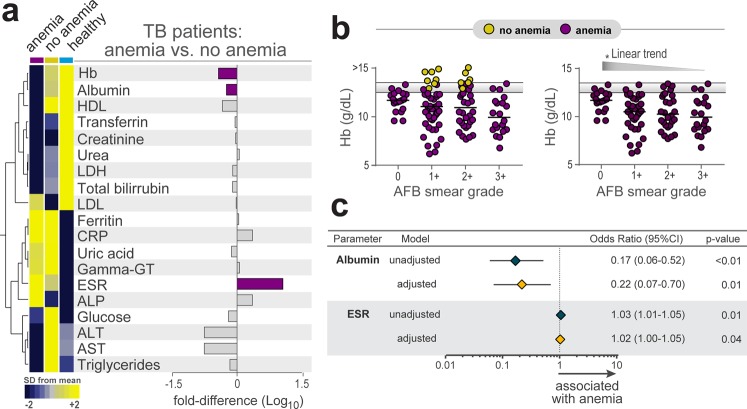
Figure 2.
Biochemical differences between pulmonary TB patients with or without anemia before antitubercular treatment initiation. (a) Data on each parameter was Log10 transformed. Mean values for each indicated clinical group were z-score normalized and a Hierarchical cluster analysis was performed to illustrate the overall biochemical profiles. Fold differences (TB anemia vs. TB no anemia) were calculated and statistically significant differences are highlighted in purple. (b) Levels of hemoglobin in the in all TB patients (left panel) or only in anemic patients (right panel) stratified by AFB smear grade were compared using the Kruskal-Wallis test with non-parametric linear trend post hoc test. **p < 0.001. Yellow plots represent non-anemic TB patients, while purple plots represent anemic TB patients. Horizontal lines represent the two cut-offs for anemia for men and women. (c) Logistic linear regression model adjusted to significant biochemical parameters in Supplementary Table 1 (p < 0.2) was used to test independent associations between biochemical parameters and presence of anemia (OR, Odds ratio; 95%CI, 95% confidence interval). Only parameters which remained with p < 0.05 in the adjusted model are shown. Data represent OR per 1Log10 increase in values of the parameters.

