Figure 5.
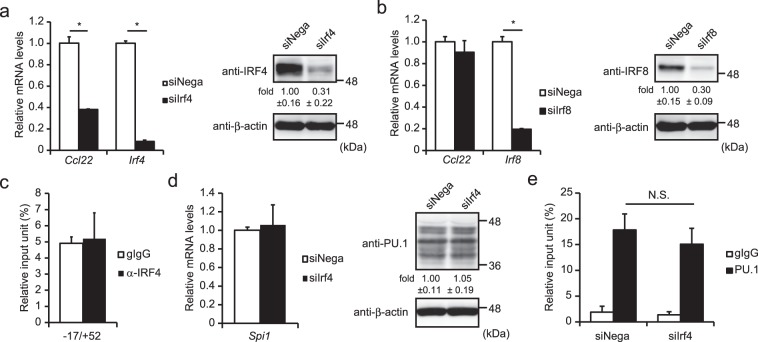
Involvement of IRFs in the expression of Ccl22 in BMDCs. (a,b) BMDCs were transfected with negative control siRNA (siNega), Irf4 siRNA (siIrf4) (a), or Irf8 siRNA (siIrf8) (b). At 48 h after transfection, relative mRNA levels were determined by quantitative RT-PCR after normalizing to mouse Gapdh mRNA levels. Data are expressed as the ratio of the expression level of the respective control siRNA-transfected cells. Western blotting analyses were performed using transfectants, which were harvested at 48 h after transfection (right in a,b). (c) ChIP assay was performed by using either goat IgG (gIgG) or anti-IRF4 Ab (IRF4) in BMDCs. The amounts of immunoprecipitated chromatin were determined by quantitative PCR targeting the −17/+52 region of the Ccl22 promoter. Data are expressed as the percentage of the input for each ChIP assay. (d) mRNA level (left) and protein level (right) of PU.1 in control (siNega) or Irf4 knockdown cells (siIrf4). (e) PU.1 binding degree to −17/+52 in control (siNega) or Irf4 knockdown cells (siIrf4) determined by ChIP assay. Results are shown as means + S.D.s (n = 3). Similar results were obtained in three independent experiments. *p < 0.05.

