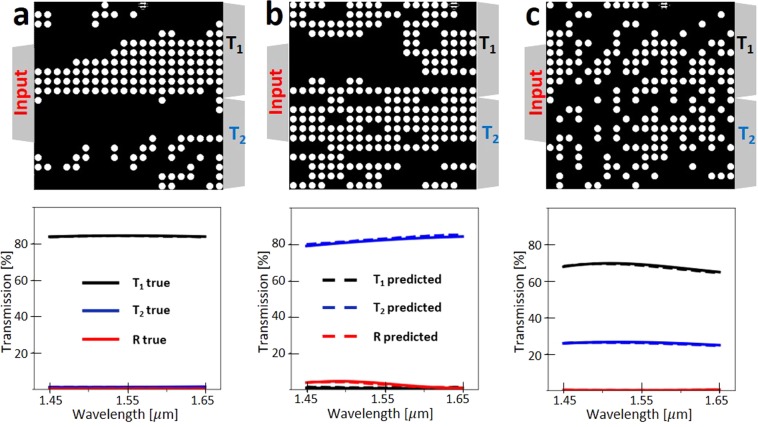
Figure 4.
Spectrum approximation using deep ResNet. We use 16,000 (80% of the total) input data for training and 4,000 (20% of the total) data for testing. a, b, and c are comparison of ResNet predicted spectral response of the three representative power splitters to the numerically verified spectral responses. Black, blue, and red colors stand for transmission at port 1, transmission at port 2, and reflection at the input port, respectively. Solid lines are true values for a given hole vector and dashed lines are predicted spectral response using ResNet.

