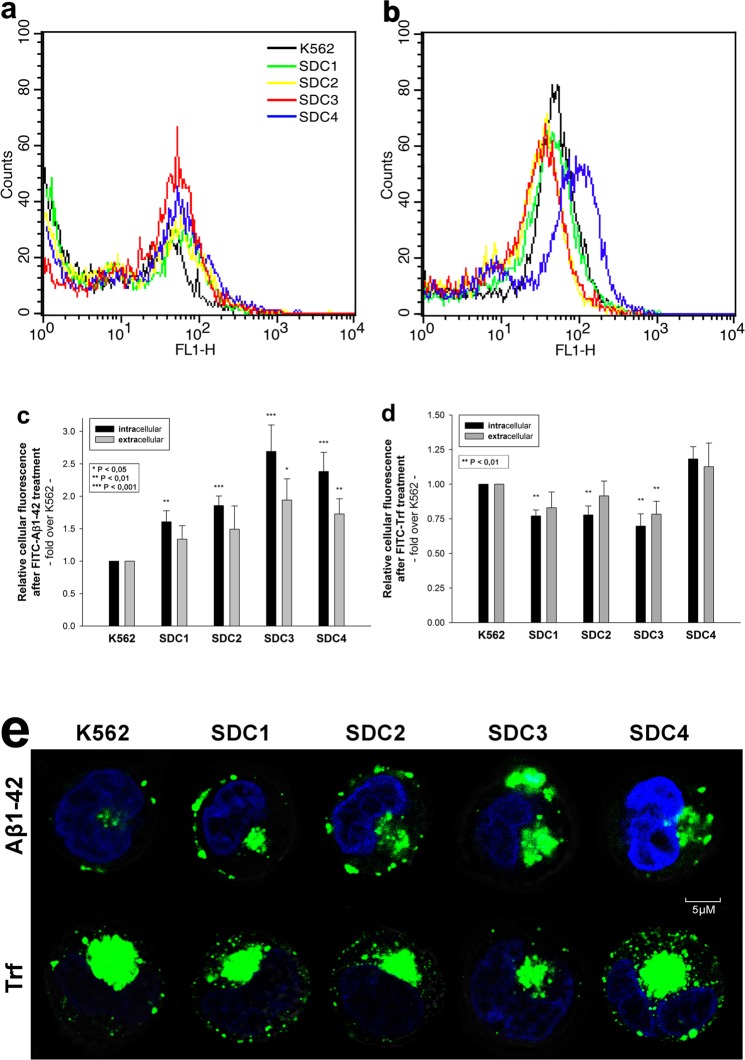
Figure 3.
Cellular uptake of Aβ1–42 and Trf into WT K562 cells and SDC transfectants. WT K562 cells and SDC transfectants were incubated with FITC-labeled Aβ1–42 or Trf for 18 h at 37 °C. Cellular uptake of Aβ1–42 was then analyzed with flow cytometry and confocal microscopy. (a,b) Flow cytometry histograms showing intracellular fluorescence WT K562 cells and SDC transfectants, following 18 h incubation with Aβ1–42 and Trf, respectively. (c,d) Detected cellular fluorescence intensities were normalized to FITC-Aβ1–42 or FITC-Trf-treated WT K562 cells as standards. The bars represent mean ± SEM of nine independent experiments. Statistical significance vs standards (FITC-Aβ1–42 or FITC-Trf-treated WT K562 cells) was assessed by analysis of variance (ANOVA). *p < 0.05 vs standards; **p < 0.01 vs standards; ***p < 0.001 vs standards. (e) CLSM visualization of FITC-Aβ1–42 or FITC-Trf uptake into K562 cells and SDC transfectants. Nuclei of cells were stained with DAPI. Representative images of three independent experiments are shown. Scale bar = 5 μm.

