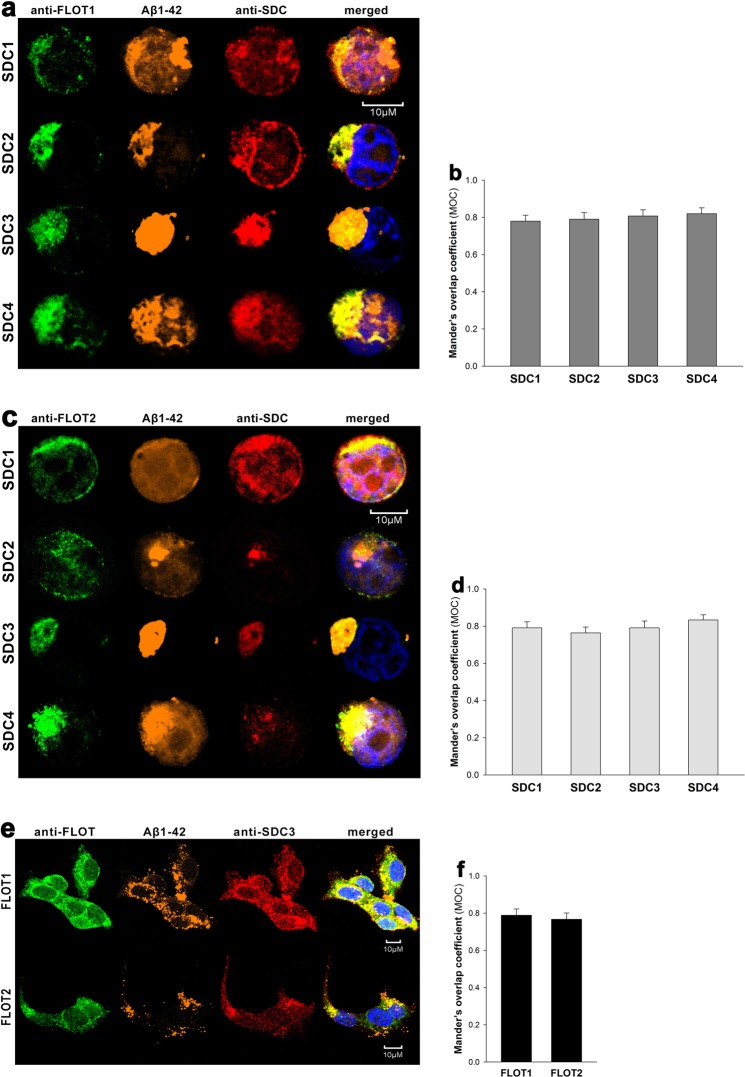
Figure 5.
Colocalization of SDCs, Aβ1–42 and flotillins. SDC transfectants and WT SH-SY5Y cells were treated with 5-TAMRA-labeled Aβ1–42 for 18 h at 37 °C. After incubation, the cells were permeabilized and treated with the respective APC-labeled SDC antibody, along with either flotillin 1 (FLOT1) or flotillin 2 (FLOT2) antibodies (both Alexa Fluor 488-labeled). Nuclei of cells were stained with DAPI and cellular uptake was then analyzed with CLSM. Representative images of three independent experiments are shown. (a,c) CLSM images of SDC transfectants treated with FITC-Aβ1–42, one of the anti-flotillin antibodies and a respective APC-labeled SDC antibody. (b,d) Mander’s overlap coefficient (MOC) ± SEM for the overlap of SDCs with either FLOT1 or FLOT2 was calculated by analysis of 21 images with ~7 cells in each image (from three separate samples). (e) CLSM images of WT SH-SY5Y cells treated with 5-TAMRA-labeled Aβ1–42, APC-labeled SDC3 antibody and FLOT1 or FLOT2 antibodies. Scale bar = 10 μm. (f) Mander’s overlap coefficient (MOC) ± SEM for the overlap of SDC3 with either FLOT1 or FLOT2 was calculated by analysis of 21 images with ~7 cells in each image (from three separate samples).

