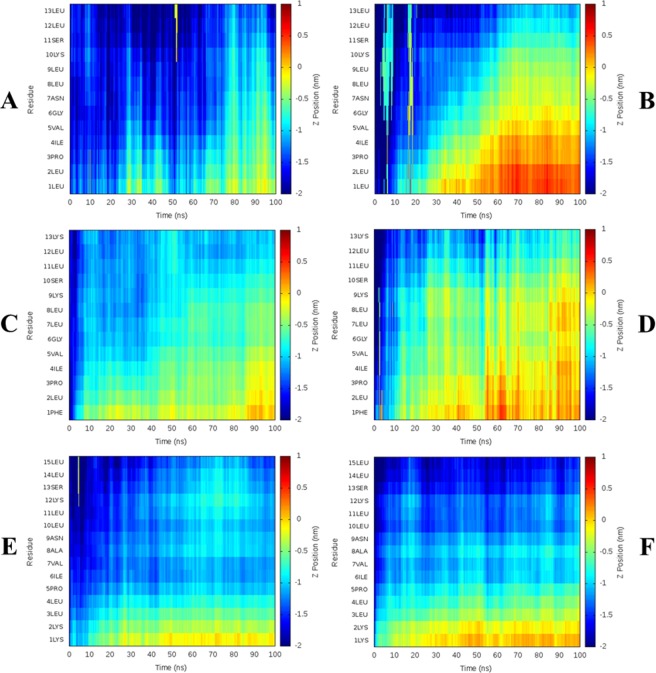
Figure 3.
Temporin B peptide topology during 100 ns MD simulation in model membranes. The depth of temporin B (A,B), temporin B L1FK (C,D) and temporin B KKG6A (E,F) insertion is shown as the Z-position relative to the phosphate group for each residue averaged over all eight peptides in each simulation. Positive or negative values indicate the peptides are below or above the phosphate group, respectively for peptides in POPE/POPG (A,C,E) or POPG (B,D,F).

