
Figure 5.
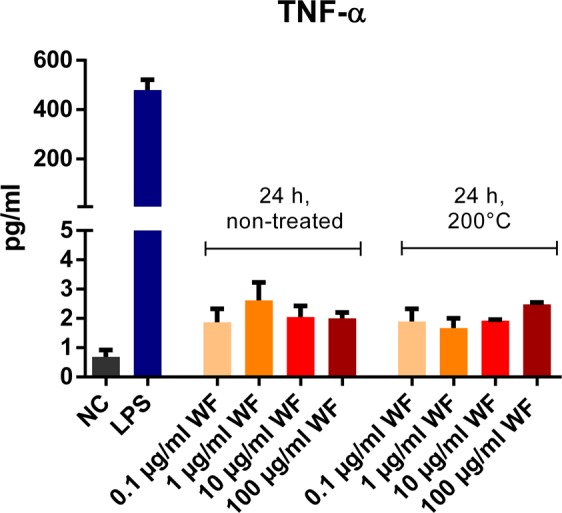
Comparison of non-treated zinc- and copper-containing welding fumes vs. welding fumes treated with 200 °C for 17 h. TNF-α release after 24 hours of incubation with increasing concentrations of welding fume particles (WF) (0.1 µg/ml, 1 µg/ml, 10 µg/ml, 100 µg/ml) was measured. Pyrogen free water was provided as negative control (NC) and 10 ng/ml LPS as positive control (LPS). Data are shown as mean ± SEM, (n = 3). Comparison of corresponding concentrations (0.1 vs. 0.1 µg/ml) for non-treated and heat-treated welding fume showed no significant differences.