Figure 6.
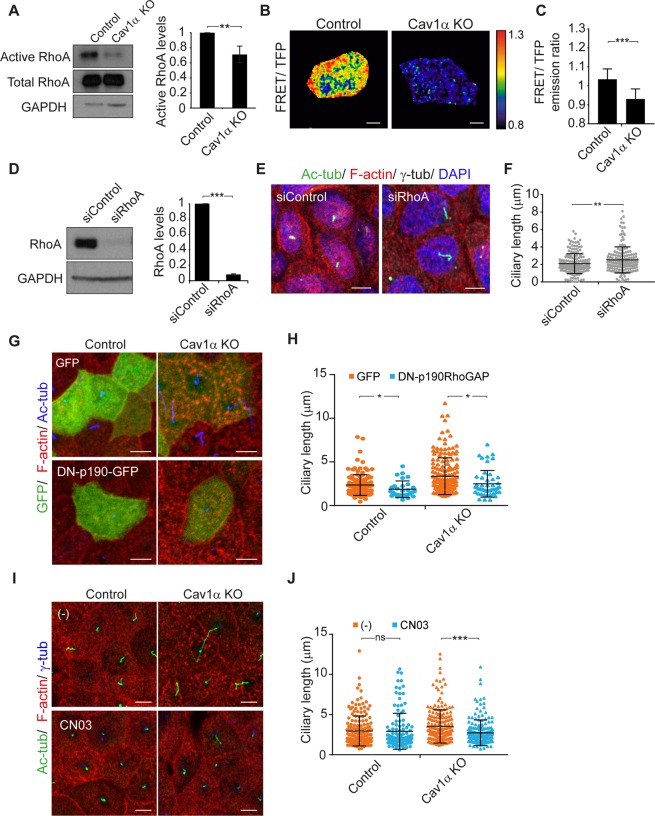
Cav1α knockout reduces RhoA activity. (A) GTP-bound RhoA from control and Cav1α KO cells were pulled-down by GST-rhotekin-RBD and subjected to immunoblot analysis for total and active RhoA levels (left panel). The histogram represents active RhoA normalized to total RhoA levels in Cav1α KO cells relative to control cells (right panel). (B,C) FRET-based analysis of RhoA activity was done in living control and Cav1α KO cells, grown for 5 days. FRET efficiency is shown on the right with the upper and lower limits of the ratio range indicated in the color bar (B). The histogram represents the quantitative measurements of FRET/TFP ratios in the apical membrane; n = 50 cells per condition (C). (D) Control cells were treated with control siRNA or siRNA targeting RhoA. Cell extracts were immunoblotted for RhoA, and GAPDH was used as a control of protein loading (left panels). The histogram shows the expression levels of RhoA in cells transfected with the indicated siRNAs. RhoA signals were normalized to GAPDH (right panel). (E,F) Control and RhoA KD cells were grown for 72 h after transfection and stained for acetylated tubulin, F-actin, γ-tubulin and nuclei (E). The scatter-plot represents ciliary lengths, measured in µm, in cells transfected with the indicated siRNAs; more than 575 cells were analyzed for each condition (F). (G,H) Control and Cav1α KO cells were transfected with GFP or DN-p190RhoGAP-GFP for 3 days and then analyzed by immunofluorescence. Cells were stained for F-actin and acetylated tubulin (G). The scatter-plot represents the length of cilia measured in µm (H). (I,J) Control and Cav1α KO cells were untreated (−) or treated with 0.5 µg/ml CN03 for 4 h and then analyzed by immunofluorescence. Cells were stained for acetylated tubulin, F-actin and γ-tubulin (I). The scatter-plot represents the length of cilia measured in µm; more than 250 cells were analyzed for each condition (J). Scale bars, 5 µm. Data were pooled from three independent experiments and are presented as the mean ± SD. *P < 0.05; **P < 0.01; ***P < 0.001; ns, non-significant.

