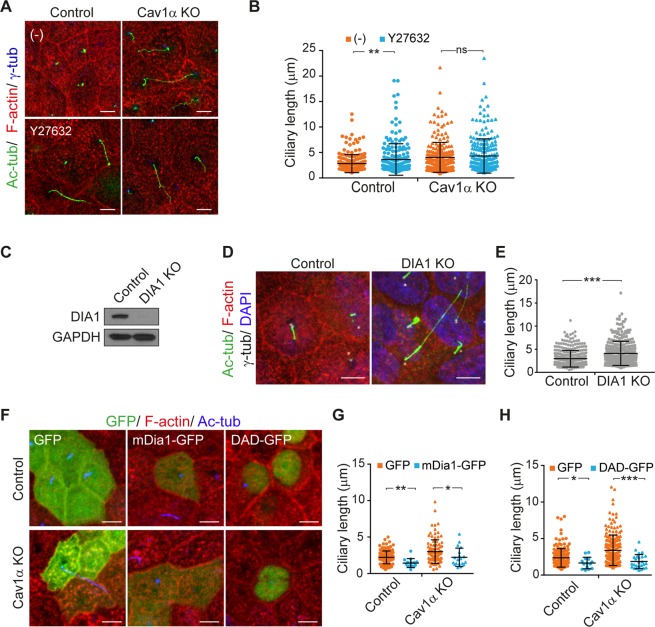
Figure 7.
Cav1α controls cilium length via ROCK and Dia1. (A,B) Control and Cav1α KO cells were untreated (−) or treated with 10 µM Y27632 for 24 h and then stained for acetylated tubulin, F-actin and γ-tubulin (A). The scatter-plot represents the total length of cilia measured in µm; more than 700 cells were analyzed for each condition (B). (C) Control and DIA1 KO cells were analyzed by immunoblotting for DIA1. GAPDH was used as a loading control. (D,E) Control and DIA1 KO cells were grown for 5 days and stained for acetylated tubulin, F-actin, γ-tubulin and nuclei (D). The scatter-plot represents ciliary lengths measured in µm; more than 700 cells were analyzed in control and DIA1 KO cells (E). (F–H) Control and Cav1α KO cells were transiently transfected with the indicated constructs, then fixed and stained after 72 h for F-actin and acetylated tubulin (F). The scatter-plots represent the ciliary lengths measured in µm; more than 100 cells were analyzed for each condition (G,H). Scale bars, 5 µm. Data in B, E, G and H were pooled from at least three independent experiments and are represented as the mean ± SD. *P < 0.05; **P < 0.01; ***P < 0.001; ns, non-significant.

