Figure 5.
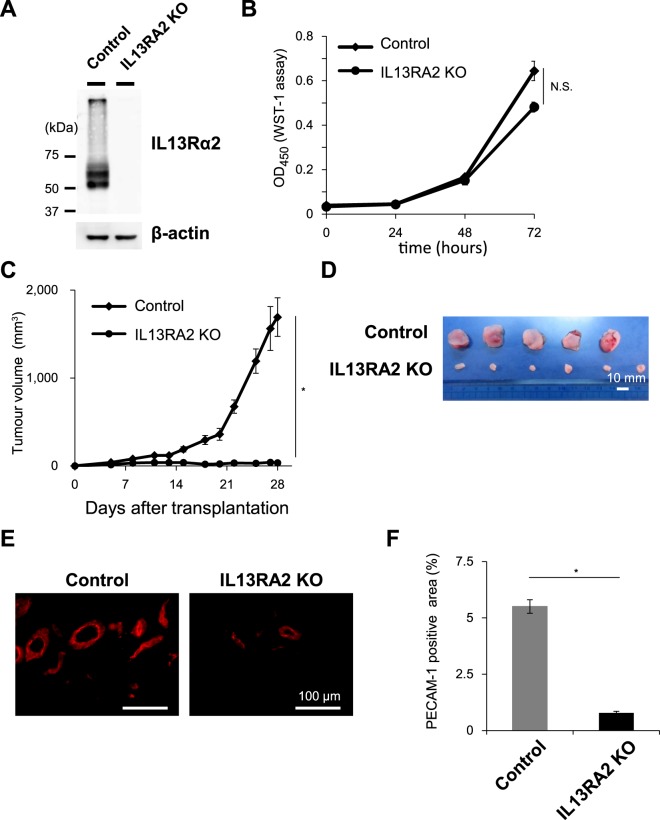
Roles of IL13Rα2 in the in vivo tumour formation and angiogenesis in A375 xenograft model. IL13RA2 gene was knocked out in A375 melanoma cells. (A) The expression of IL13Rα2 in A375-Control and A375-IL13RA2 KO cells was determined by immunoblotting analysis with the anti-IL13Rα2 (KH7B9) and anti-β-actin antibodies. Cropped images from the same blots are shown. Full-length blots are presented in Supplementary Fig. S7. (B) In all, 3 × 10³ of A375-Control (n = 6) and A375-IL13RA2 KO (n = 6) cells were seeded into 12-well plates and allowed to grow for 3 days. Cells were harvested and were counted at the indicated period. (C) The A375-Control and A375-IL13RA2 KO cells were subcutaneously transplanted into immunodeficient mice. Tumour growth was measured using callipers and was calculated from minor axis and major radius. (D) Images of representative tumours. Scale bar: 10 mm. (E) Sections of tumours derived from A375 Control (n = 5) and A375-IL13RA2 KO (n = 6) cells were subjected to immunofluorescence staining with the anti-PECAM-1 antibodies. Scale bar: 100 μm. (F) PECAM-1 positive area represented as the fraction of total image area. All values are mean ± SE. *p < 0.05; Student’s t-test.

