Figure 1.
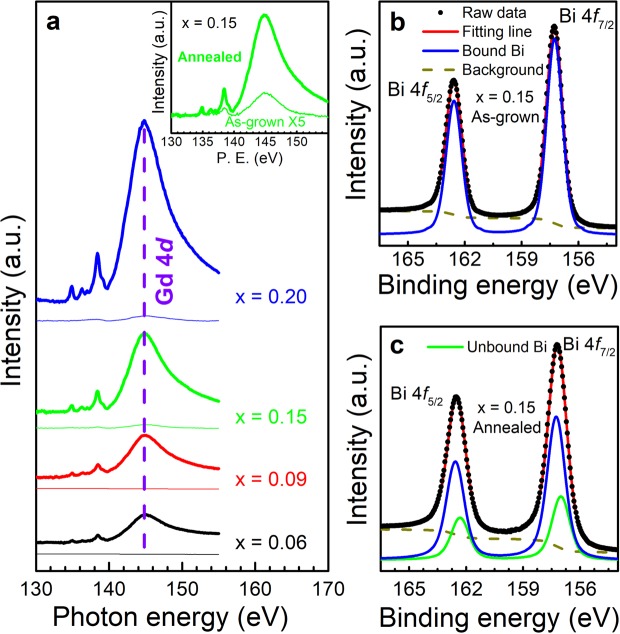
Near edge x-ray absorption fine structure (NEXAFS) and x-ray photoelectron spectroscopy (XPS) of GdxBi2−xTe3. (a) Gd N-edge NEXAFS spectra taken for as-grown and annealed samples with various x (=0.06, 0.09, 0.15, and 0.20). The thin and thick lines correspond to the spectra for as-grown and annealed samples, respectively. The inset shows a typical comparison of the NEXAFS spectrum at x = 0.15 before and after annealing. The data of as-grown sample have been multiplied by 5. (b,c) Bi 4 f core-level XPS spectra of x = 0.15 taken for as-grown and annealed samples, respectively. Before annealing, the data are fitted using two peaks for Bi 4f7/2 and Bi 4f5/2 with binding energies of 157.0 and 162.3 eV, in addition to a normal-state background signal (dashed line). After annealing, the data are resolved into two chemical states of bound Bi (blue line) and unbound Bi (green line) with a slight energy shift, about 0.2 eV.

