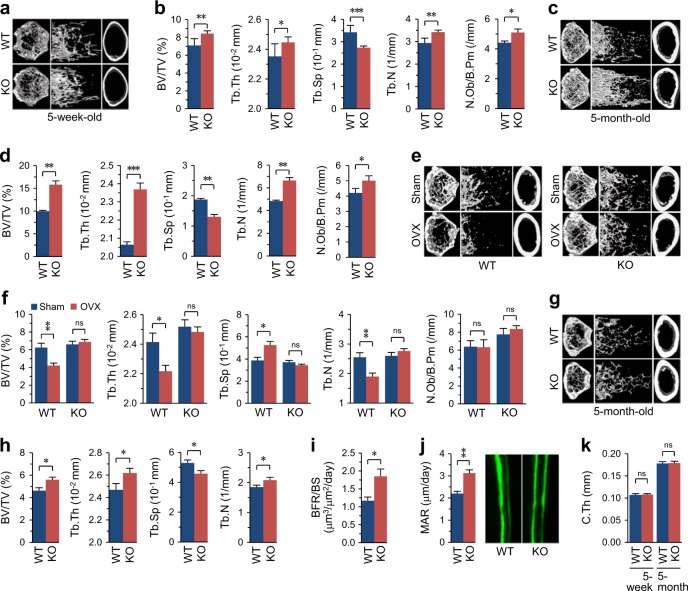
Fig. 1. Cytl1−/− mice exhibit enhanced bone mass and resistance to ovariectomy-induced bone resorption.
a, b Representative 3-dimensional reconstructive images of trabecular and cortical bone from the distal femur metaphyses of 5-week-old WT and Cytl1−/− (KO) male mice (a). The BV/TV (bone volume/total volume), Tb.Th (trabecular thickness), Tb.Sp (trabecular separation), Tb.N (trabecular number), and N.Ob/B.Pm (Number of osteoblast per bone perimeter) were determined from 10 different mice (b). c, d Representative 3-dimensional reconstructive images of 5-month-old WT and KO male mice (c) and BV/TV, Tb.Th, Tb.Sp, Tb.N, and N.Ob/B.Pm from 10 different mice (d). e, f Representative 3-dimensional reconstructive images of trabecular and cortical bone from the distal femur metaphyses obtained 8 weeks after ovariectomy (OVX) or sham operation performed on 10-week-old WT and KO female mice (e). The BV/TV, Tb.Th, Tb.Sp, Tb.N, and N.Ob/B.Pm were determined from 8 different mice (f). Littermates of WT or KO mice were either sham operated or subjected to OVX. g, h Representative 3-dimensional reconstructive images of trabecular and cortical bone from the distal femur metaphyses of 5-month-old female KO mice and WT littermates (g) and BV/TV, Tb.Th, Tb.Sp, and Tb.N from 7 different mice per group (h). i, j New bone formation was measured by double calcein labeling. Bone formation rate/bone surface (i) and the mineral apposition rate (MAR) (j) were measured at the distal femur metaphyses of 5-month-old WT and KO mice (n = 8 mice/group). k The cortical bone thickness (C.Th) was determined from KO mice and WT littermates (n = 10 mice/group). Data represent the means ± SEM from the indicated numbers of mice; *p < 0.05, **p < 0.005, and ***p < 0.0005, as determined by two-tailed t-test; ns not significant

