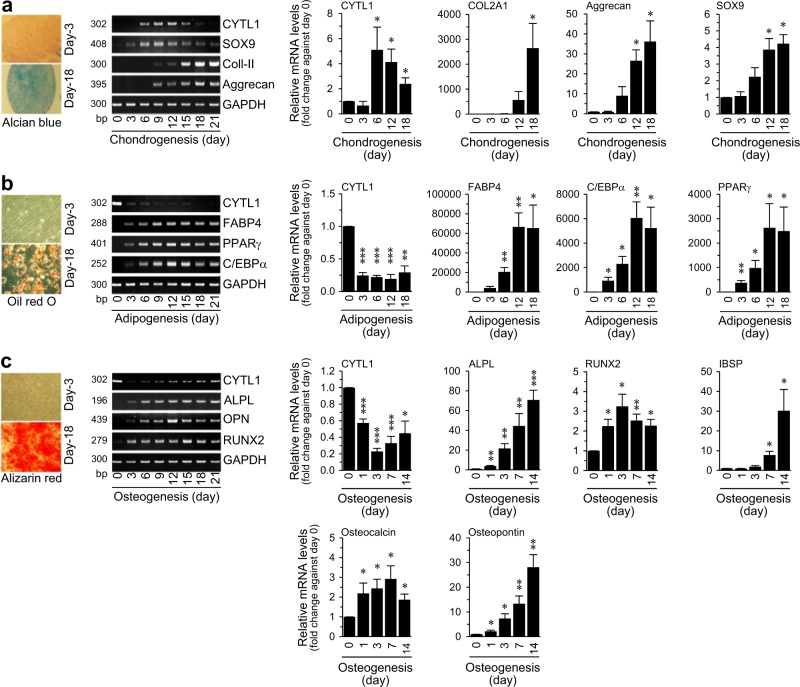
Fig. 2. Differential expression of CYTL1 during hMSC differentiation.
a–c Chondrogenic (a), adipogenic (b), and osteogenic (c) differentiation of hMSCs. Representative lineage-specific staining images are presented in the left panels. Representative RT-PCR images and qRT-PCR analyses (n = 8) of CYTL1 and the indicated differentiation markers are presented in the middle and right panels. Data represent the mean ± SEM from six independent experiments. P-values were determined by one-way ANOVA

