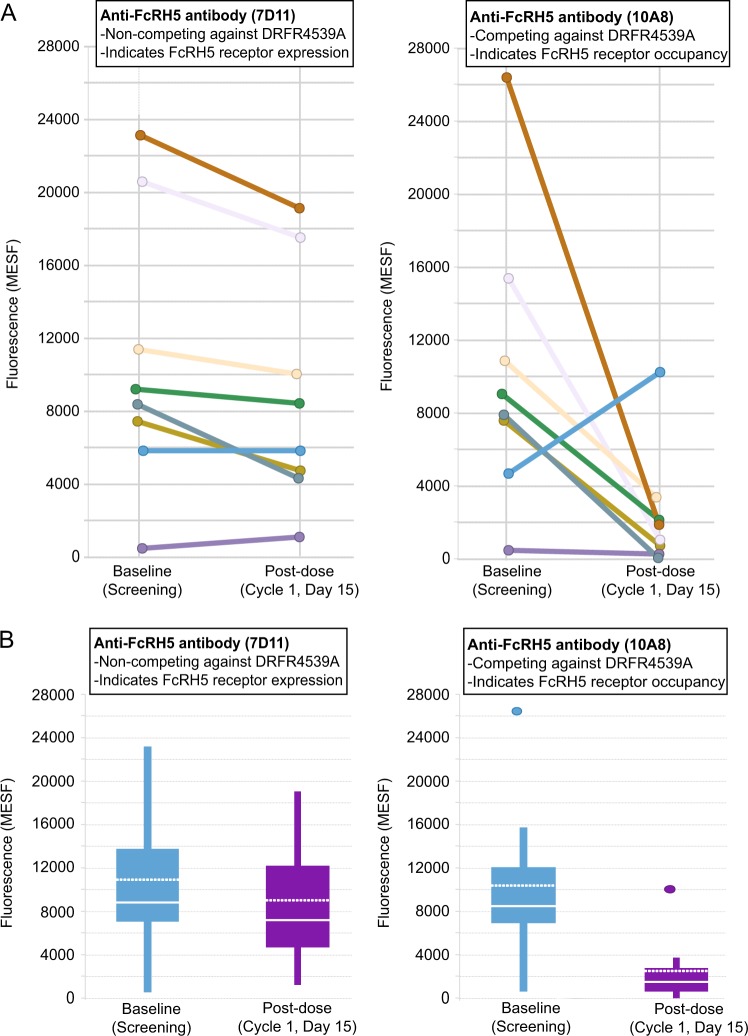
Fig. 2. FcRH5 expression as measured by clone 10A8 and clone 7D11 in patients at baseline and post-dose.
a Spaghetti plot of baseline and post-dosing flow cytometry data for each patient showing staining intensity—measured as molecules of equivalent soluble fluorochrome (MESF)—by an anti-FcRH5 antibody pair consisting of clone 10A8, a competing and blocking antibody with respect to DFRF4539A, and clone 7D11, a non-competing and non-blocking antibody with respect to DFRF4539A. b Box plot summary of FcRH5 receptor expression and receptor occupancy in patient samples at pre-dose and post-dose timepoints

