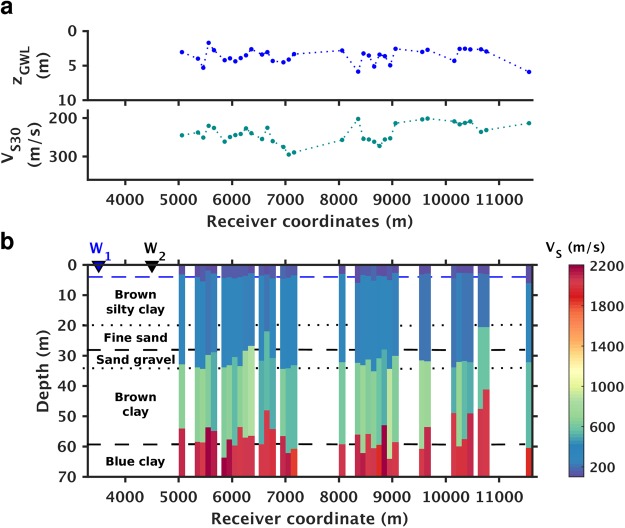
Figure 3.
Shear-wave velocity (Vs) inversion results and ground truth comparison. (a) Depths of groundwater levels (GWL) (upper) and Vs30 estimates (lower) extracted from the surface wave inversion results. (b) Pseudocolor display of Vs profiles and comparisons against well data. In (b), W1 and W2 mark surface locations of the two reference wells shown in Fig. 1; the blue dashed line denotes the depth of the ground water level provided by water well W1; the black dashed lines correspond to lithological horizons obtained from geotechnical well W2.

