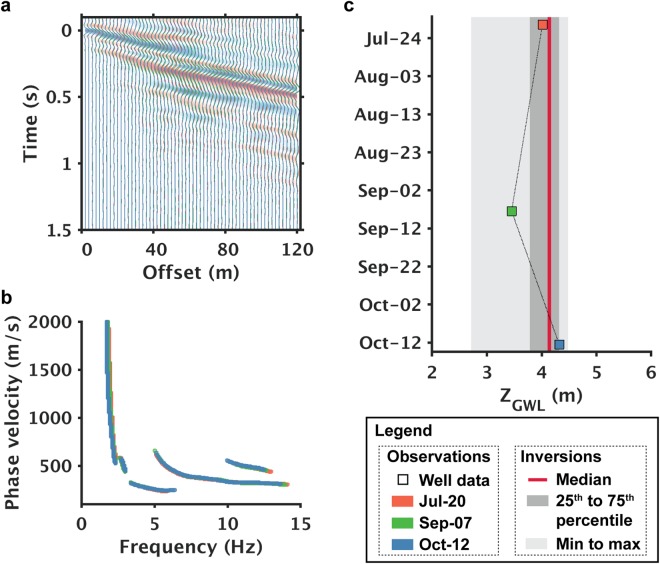
Figure 4.
Time-lapse repeatability demonstration of ambient noise analysis in (a) space-time domain, (b) frequency-velocity domain, and (c) in terms of groundwater levels obtained from the model domain. Color sequence of red, green, and blue denote chronological orders of the monitoring period. In (c), the median, min-max range, and percentiles are calculated based upon all the topmost best-fitting models associated with the monitoring period.

