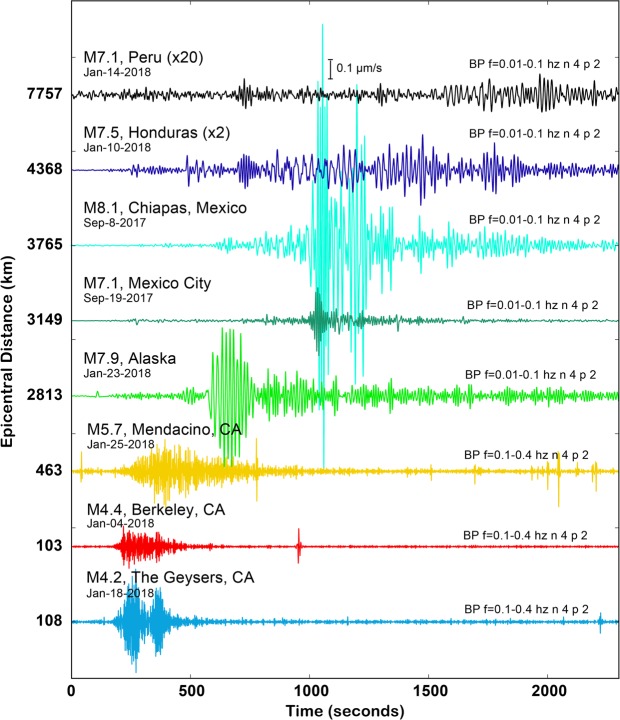
Figure 5.
Example earthquakes recorded by the Sacramento Dark Fiber DAS array. The recorded data are plotted as strain-rate after multiplying by the gauge length (10 m) to convert to units proportional to velocity (1e-6 m/s), and have been averaged over 100 m of linear fiber length (50 traces) and then bandpass filtered in the 0.1–0.4 Hz range for regional events, and 0.01–0.1 Hz for teleseisms. Events are sorted by increasing epicentral distance from Sacramento. Earthquake amplitudes for the Peru and Honduras events are scaled by the factors in parentheses.

