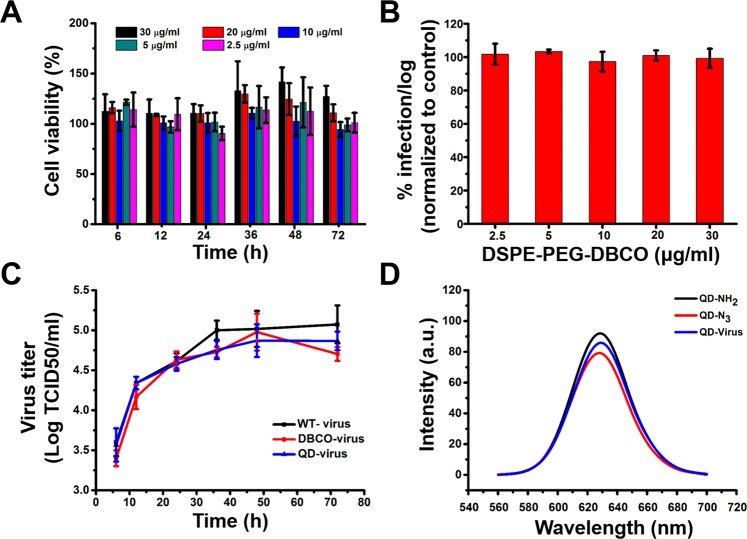
Figure 2.
Characterization of modified Vero cells and PEDVs. (A) MTT assay of Vero cells cultured at different concentrations of DSPE-PEG-DBCO for different hours. Each data point represents mean ± standard deviation (n = 9, P < 0.05) and was normalized to the Vero cells cultured without DSPE-PEG-DBCO in DMEM at the same time. (B) Titer of virus labeled with different concentrations of DBCO. Each data point represents mean ± standard deviation (n = 9, P < 0.05). (C) One-step growth curves of wild-type virus (WT-virus), DBCO labeled virus (DBCO-virus), and QD modified virus (QD-virus). Each data point represents mean ± standard deviation (n = 9, P < 0.05). (D) The emission spectra of QD-NH2 (black), QD-N3 (red) and QD-virus (blue).

