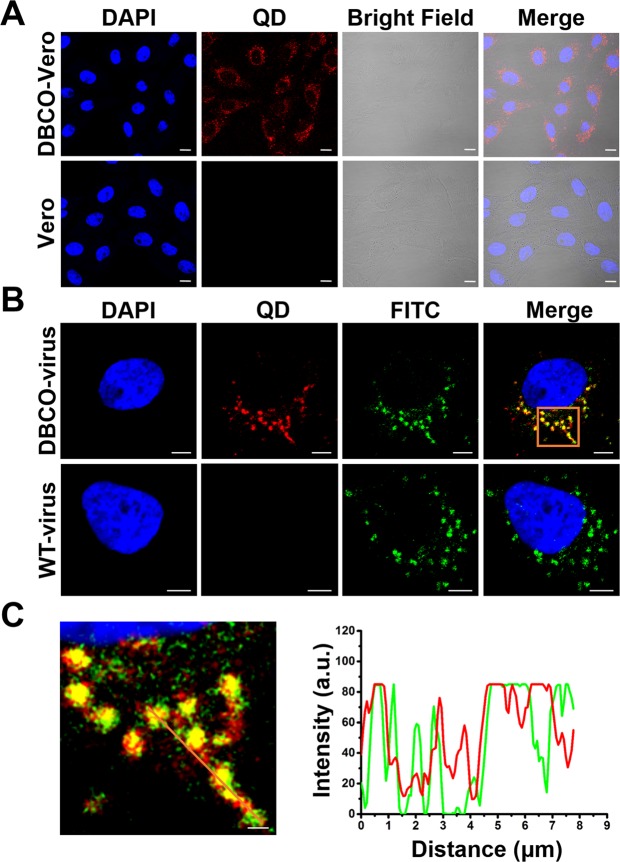
Figure 3.
Specificity of the QD-N3 labeling on the DBCO-installed Vero cells and virus. (A) Multimode imaging of Vero cells with or without DSPE-PEG-DBCO labeling. Scale bars, 10 µm. (B) Fluorescence imaging of DBCO-viruses and wild type viruses (WT-virus) in Vero cells, including fluorescence images of the QDs (red), immunofluorescent signals of viruses (green), DAPI (blue), and their merged images (yellow). Scale bars indicate 5 µm of regular views. (C) The distributions of the signals from QDs (red) and immunofluorescent signals of viruses (green) along the line. Scale bar, 1 µm.

