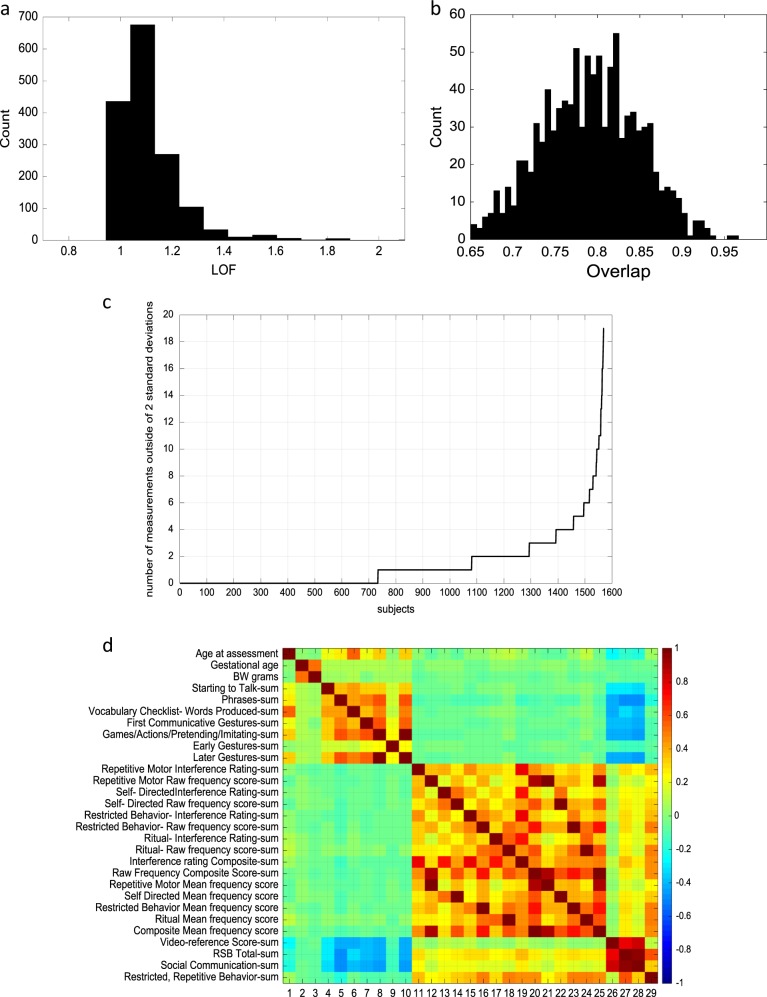
Fig. 1.
a Distribution of local outlier function (LOF) scores. Scores greater than 1.32 are classified as anomalies. Although histograms are 1-dimensional, scores are calculated from the data records of each participant which are multidimensional. As an analogy, the distance between two points in 3- dimensional space is a 1-dimensional number. As a test, if the 80 anomalous toddlers are omitted and LOF scores are recomputed, only 6 subjects obtain LOF scores greater than 1.32. Note these 6 had initial LOF scores near the 1.32 threshold. For this example, 5% was chosen as the LOF threshold because it corresponded to a point at which the LOF distribution changed from a “bump,” i.e., a somewhat normal looking distribution to a more uniform distribution. Such a region represents a different and lower density area of the data space where anomalies are expected to be found. For other datasets, the appropriate LOF threshold might correspond to a different percentage of the data, e.g., 1 or 10%. As an example of an unsupervised anomaly detection approach, we were able to determine that 80 children had LOF > 1.32 scores out of the overall sample of 1570 toddlers. b Overlap between anomalies detected in full sample vs. 1000 random samples of half the data. Many anomaly detection routines are also relatively robust to sample size. To illustrate this, we randomly sampled the data set to obtain 1000 half size samples. The overlap in anomalies found in the samples with the full data set is shown. On average, 74% of the anomalies (LOF > 1.32) found in the half size samples occurred in the full data set. Furthermore, the correspondence between the LOF scores in the full sample and the half sized sample is about 91%. On average 94% of the anomalies (LOF > 1.32) found in the half size samples have an LOF score of 1.22 or more in the full data set. All of this is a sign that LOF scores are relatively stable for the sample under consideration. The goal of this evaluation was to test how much the LOF score depended on the sample size and thus, whether a threshold determined as anomalous in one sample could be used for a smaller sample. More generally, we evaluated how much the LOF score varied by comparing the LOF scores of a subject in the half size samples to the LOF score in the full sample. c An alternative way to view the sample data from LOF scores shows number of subjects outside of two standard deviations. d In addition, the data can be plotted to illustrate the levels of correlations between variables assessed in a matrix plot. Multiple waves of data collection for ages 18–24 months, would allow for testing and retesting of the reliability of these patterns with these dimensions of observations as the sample size increases

