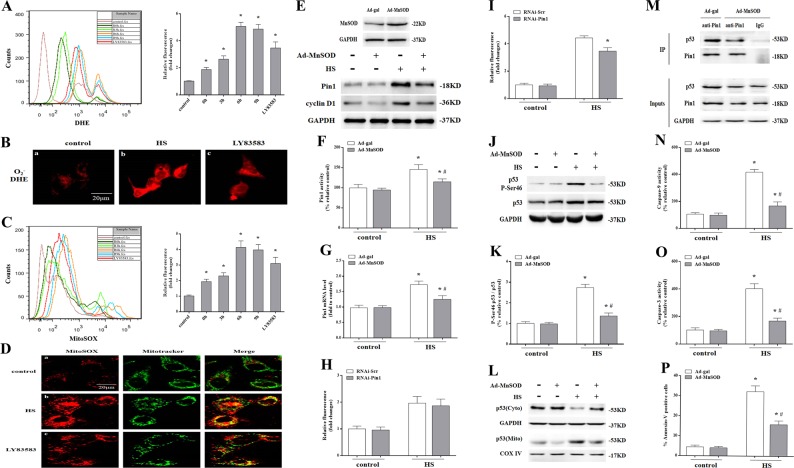
Fig. 8. The role of reactive oxygen species (ROS) (O2−.) on Pin1-mediated p53 transcription-independent apoptotic activity after heat stress (HS).
The p53+/+ mouse aortic endothelial cells (MAECs) were exposed to 43 °C for 2 h, then incubated at 37 °C for 0, 3, 6, or 9 h. LY83583 was used as a positive control for O2−. (a–d). a ROS (O2−.) induced by HS was quantified by flow cytometry using dihydroethidium (DHE) staining. b Confocal laser scanning microscopy images of fluorescently labeled cells (red fluorescence). c Mitochondrial superoxide induced by HS was quantified by flow cytometry using MitoSOX staining. d Confocal laser scanning microscopy images of fluorescently labeled cells. The red fluorescence represents mitochondrial superoxide, green fluorescence represents Mito Tracker, orange fluorescence represents generation of mitochondrial superoxide. The p53+/+ MAECs were transfected with Ad-MnSOD 24 h in advance, exposed to 43 °C for 2 h, then incubated at 37 °C for 0 h (e–g). e Western blots of MnSOD protein expressed in transfected cells. Pin1 and cyclin D1 levels were measured by western blots. f Quantification of Pin1 activity. g Quantification of Pin1 mRNA. h The p53+/+ MAECs were transfected with Pin1 siRNA 48 h in advance, exposed to 43 °C for 2 h, then further at 37 °C for 0 h. Quantification of mitochondrial superoxide was analyzed by Flow cytometry. i The p53+/+ MAECs were transfected with Pin1 siRNA 48 h in advance, exposed to 43 °C for 2 h, then incubated at 37 °C for 6 h. Quantification of mitochondrial superoxide was analyzed by Flow cytometry. The HUVECs were transfected with Ad-MnSOD 24 h in advance, exposed to 43 °C for 2 h, then incubated at 37 °C for 6 h (j–k). j P-Ser 46 p53 and p53 levels were detected by western blot. k Quantification of the P-Ser 46 p53 and p53 ratio. The p53+/+ MAECs were transfected with Ad-MnSOD 24 h in advance, exposed to 43 °C for 2 h, then incubated at 37 °C for 6 h (l–p). l Intracellular location of p53 was determined by western blot. m Interaction between endogenous p53 and Pin1 was analyzed by co-immunoprecipitation. IgG served as the negative control. n Enzymatic activity of Caspase-9 was measured using fluorogenic substrate Ac-LEHD-AFC. o Enzymatic activity of Caspase-3 was measured using fluorogenic substrate Ac-DEVD-AMC. p Apoptosis induced by HS was quantified by flow cytometry using Annexin V-FITC/PI staining.*P < 0.05 compared with the control group (37 °C); #P <0.05 compared with the HS group

