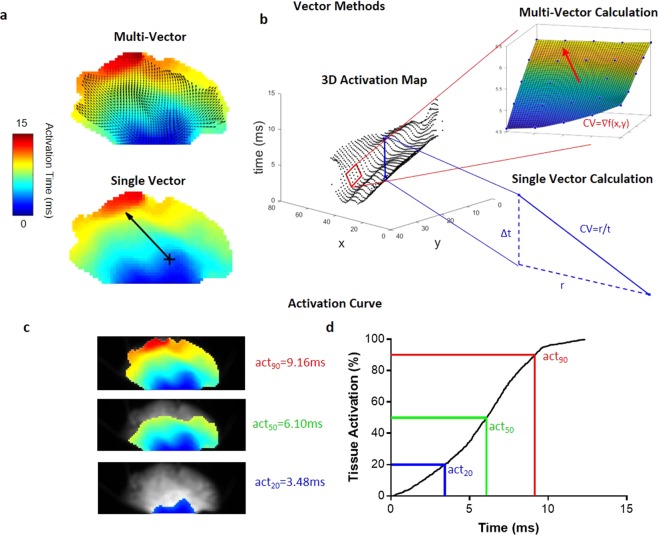
Figure 2.
ElectroMap conduction velocity module quantification methods. (a) Vector methods applied to murine atria. Top panel: multi-vector method, with local conduction vectors (arrows) calculated across the tissue. Lower panel: single velocity method, where conduction speed is measured along the vector (arrow) connecting two points. (b) Activation map represented in 3D with x,y pixel positions and activation time on z-axis. Upper inset demonstrates calculation of one local vector from a 5 × 5 pixel region by fitting of a polynomial surface (f(x,y)) to measured activation times (t(x,y)). Lower inset shows calculation of single vector velocity from activation time difference (Δt) and distance (r) between two selected points. (c) Activation of the murine atria at 20% (act20), 50% (act50), and 90% (act90), total activation. (d) The associated activation curve, with act20, act50 and act90 highlighted.

