Figure 1.
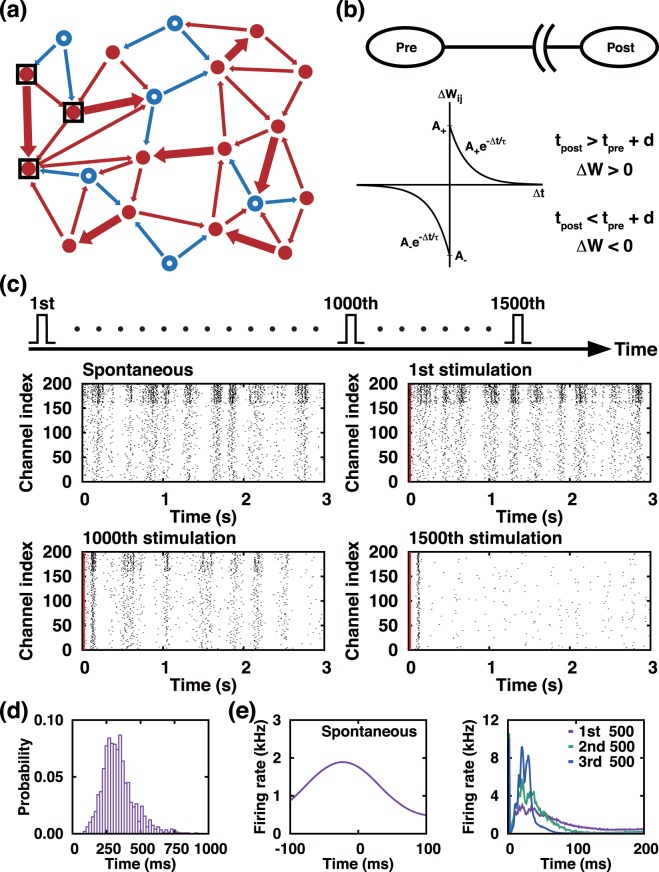
Progressive depression in bursting neural network by a periodic sequence of single-pulse stimuli. (a) Schematic illustration showing a randomly connected excitatory (red filled circles) and inhibitory (blue open circles) neurons. (b) Skewed STDP function of plastic synapses, (c) Raster plots of APs changing with the number of externally delivered stimuli [first frame: autonomous activity just before the stimulation starts, other frames: AP activities following each stimulation (vertical red line at t = 0 marks the time of the stimulation). The same pulse is delivered repetitively at every 3 s interval to a subset (20 neurons) of the population. (d) Histogram of 500 successive inter-burst-intervals of an autonomously generated PB sequence. (e) AP firing rate profile of autonomously generated PB (left frame) and those of evoked PBs immediately following the stimulating pulse (right frame) [All are an average profile based on 500 PBs]. The red (blue) arrows in (a) represent the direction of AP propagation and the strength of connections. In (b), tpre (tpost) and d represent, the spiking time of presynaptic (postsynaptic) neuron and conduction delay, respectively. In the raster plots of (c), the top 40 (bottom 160) lines are for the inhibitory (excitatory) neurons.

