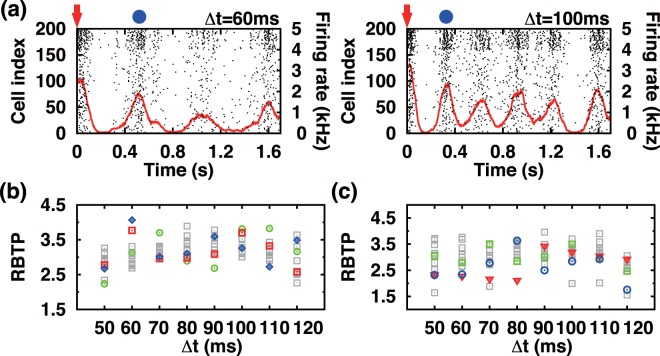
Figure 5.
Significance of Δt value in Δt paired-pulse stimulation. (a) Two exemplary raster plots showing an almost periodic sequence of recurrent bursts following a probing pulse stimulation, which is marked by a red arrow [after Δt = 60 ms training (left) or Δt = 100 ms training (right)]. (b) shows RBTP vs. Δt for 10 different initial Wij values just before the training for each value of Δt (only three randomly chosen Wij initial states are color labeled to illustrate the variability of RBTP following the initial state of Wij, (c) shows RBTP vs. Δt for 10 different groups of neurons used for the Δt stimulation [as in (b), only three randomly chosen cases are color labeled]. The same initial condition (i. e., Wij values) is used for the case of (c), while the same groups of cells are used for the training in (b). In (a), the red solid lines plot the rate of APs and the peak position of the first recurrent burst is marked by a blue dot. The value of RBTP plotted in (b) is based on 100 peak positions (blue dots) generated by 100 probing pulses while the values of Wij are kept after the Δt paired-pulse training.

