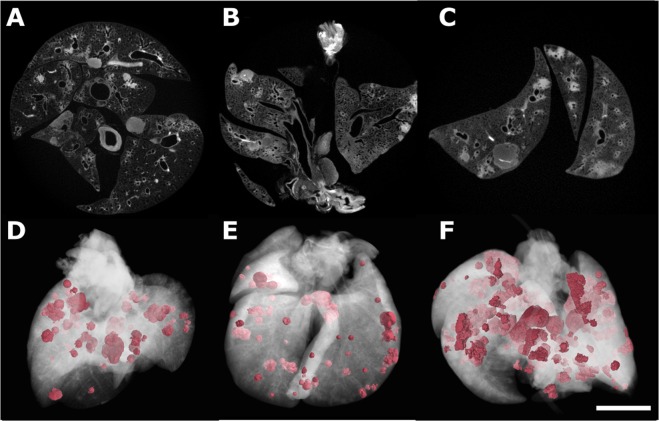
Figure 3.
2D and 3D images of three different I2E-stained tumorous lungs. Tomograms of three tumorous lung samples (A–C) with their corresponding three-dimensional renderings (D–F) shown below, with normal lung tissue represented in transparent white to allow the visualization of the tumorous lesions pseudo-colored in pink. Pink regions in (D) correspond to 16.9 % of the total volume of this specimens, while this number is equal to 20.7 % in (E), and 65.8 % in (F). Scale bar: 1 mm.

