Figure 7.
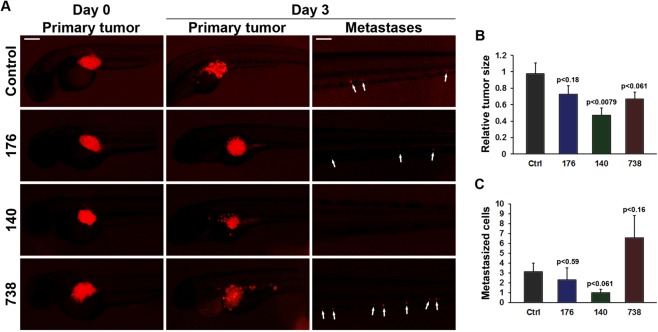
CDC25 inhibitors cause tumor regression and absence of metastasis in a zebrafish K-Ras-dependent tumor model. (A) Fluorescent microscopy images of HCT116 tumor xenografts (shown in red) immediately after implantation (Day 0) in two-days old zebrafish larvae and three days (Day 3) after implantation and treatment with DMSO vehicle (Control), UPD-176 (176), UPD-140 (140) or UPD-738 (738), in five-days old zebrafish larvae. Primary tumors and metastatic sites are shown separately. Metastasized tumor cells are indicated with white arrows. Size-bars in primary tumor images and metastatic site images correspond to 100 µm and 50 µm, respectively. (B,C) Quantifications of relative tumor volumes indicating the primary tumor size at day 3 relative to day 0 (B) or the number of metastasized tumor cells to the bone-marrow-like caudal hematopoietic plexus three days after tumor implantation (C). Results are shown as means (±SEM) of 17, 12, 12 and 17 embryos in the control, UPD-176, UPD-140 and UPD-738 groups, respectively. P-values indicate comparison between control and drug treated groups.

