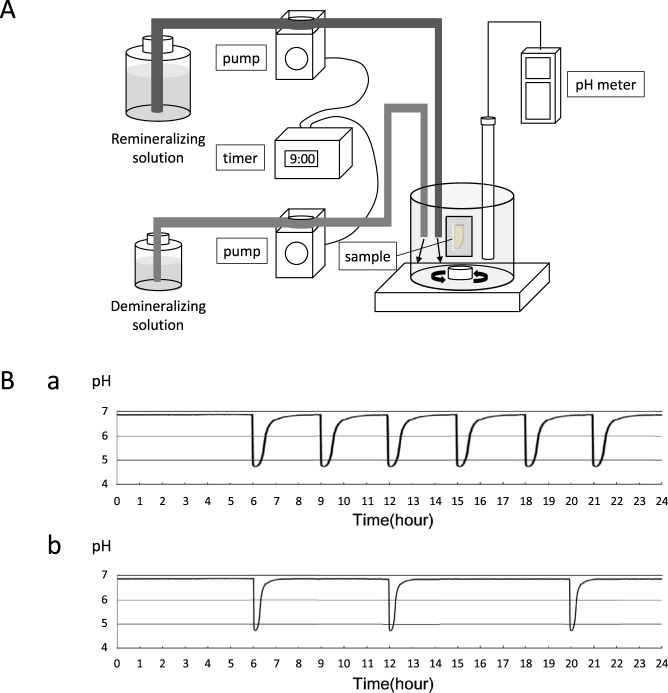
Figure 6.
Schematic diagram of automatic pH-cycling system. (A) Schema of the pH-cycling system. Demineralizing and remineralizing solutions were pumped into a plastic beaker with two delivery pumps controlled by a programmable timer. (B) Twenty-four-hour pH fluctuation patterns. (a) Demineralizing cycle (simulating a high carious risk condition); six cycles per day (at 06:00, 09:00, 12:00, 15:00, 18:00, and 21:00). The average time for the pH to reach 5.5 or less during each cycle was 30 min, and the average time to return to the initial pH was 50 min. (b) Remineralizing cycle (simulating a low carious risk condition); three cycles per day (at 06:00, 12:00, and 18:00). The average time for the pH to reach 5.5 or less during each cycle was 8 min, and the average time to return to the initial pH was 23 min.

