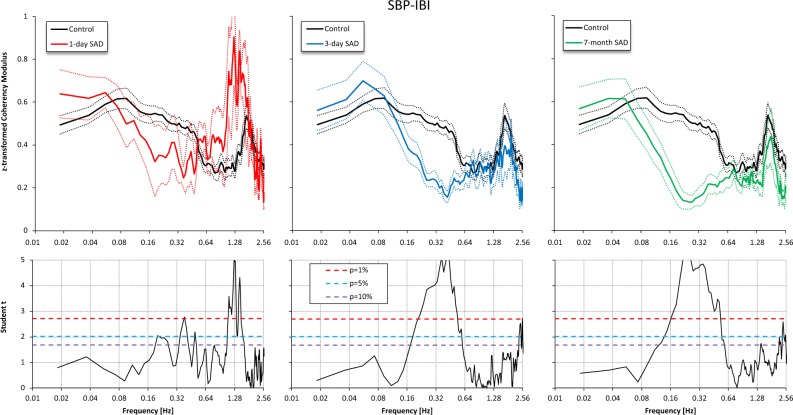
Figure 4.
Coherency Modulus after Fisher z-transform in the control group (black) vs. SAD groups 1 day (red), 3 days (light blue) and 7 months (green) after denervation. Upper panels: mean ± standard error. Lower panels: Student t statistics (see also Fig. 2). The coherency modulus in the LF band is lower after SAD, the difference with controls being highly significant 3 days and 7 months after SAD; by contrast, the coherency modulus in the ULF band is high in all SAD groups, similarly to controls.

