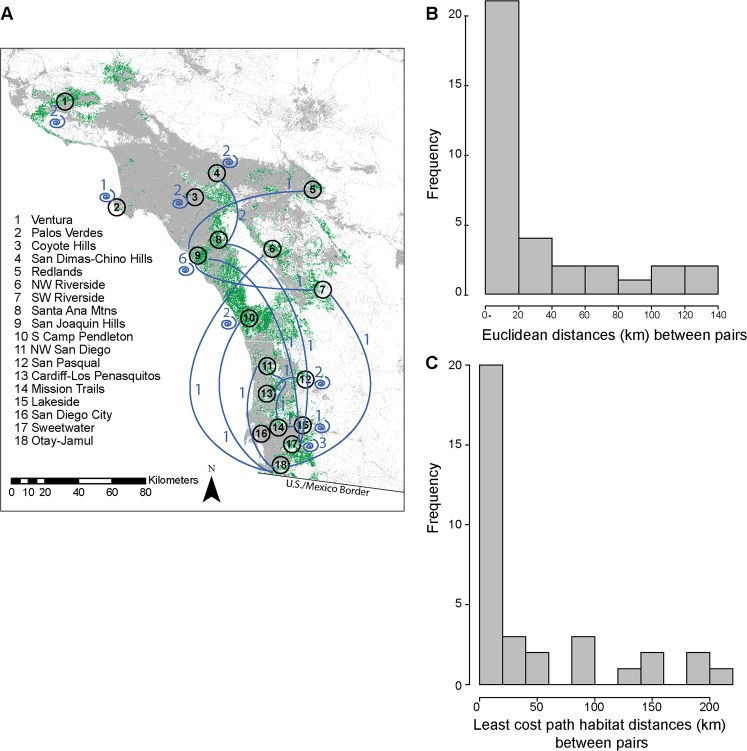
Figure 2.
(A) Mean center points for 18 regional aggregations overlaid on suitable habitat (green). Blue lines represent connections between regional aggregations based on first order relative pairs. Numbers indicate the number of pairs with individuals shared between aggregations. Spirals and corresponding numbers indicate first order relative pairs with both members found within the same aggregation. (B,C) Histograms of Euclidean and least cost path distances between relatives. Most distances were under 20 km.

