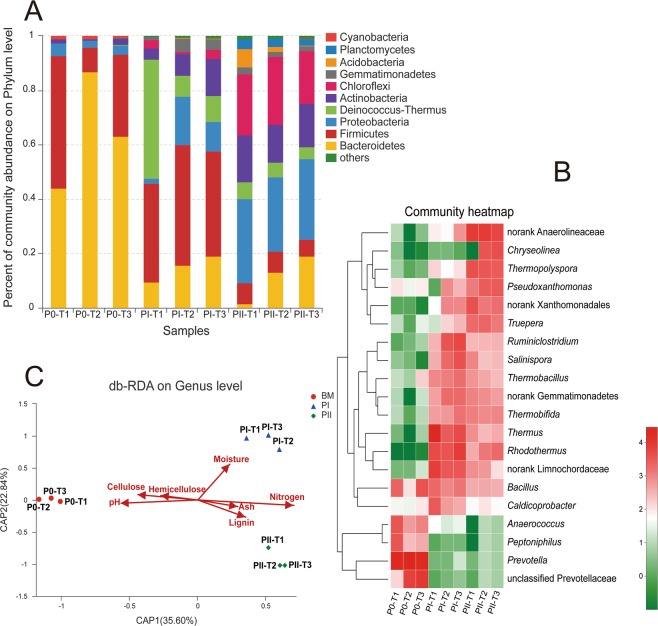
Figure 3.
Bacterial community analysis during composting. (A) Relative abundance of bacterial communities (phylum level). (B) Heat map analysis (genus level). (C) db-RDA analysis between environmental factors and bacterial groups (OTU level). OTU: operational taxonomic units; P0: end of premix; PI: end of phase I; PII: end of phase II; T1, T2, T3: different trials. The heatmap plot indicates the relative abundance of genera in different samples. The phylogenetic tree was calculated using the neighbour-joining method. The color intensity is proportional to the relative abundance of bacterial genera.

