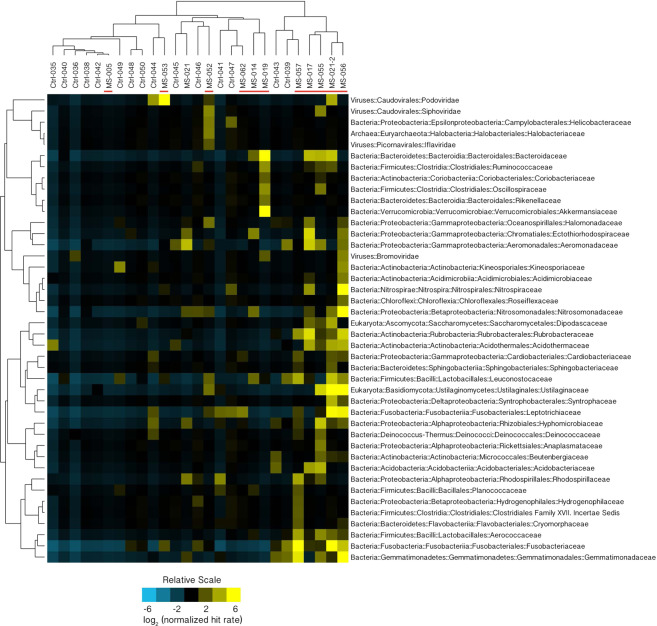
Figure 1.
Microbial Families Normalized Hit Rate Hierarchical Cluster 3.0 Analysis46. MS candidate microbial families (N = 42) where at least one of the MS samples (red bars) was significantly overrepresented (false discovery rate, q < 0.05) relative to the set of controls is displayed here. The normalized HRs were Log2 transformed. Rows were centered by subtracting the mean value for each row from every cell in the row. Yellow indicates an increase over the mean value (black) while blue shows a decrease. On the right of the figure there is a prominent cluster containing 4 MS samples and no controls.

