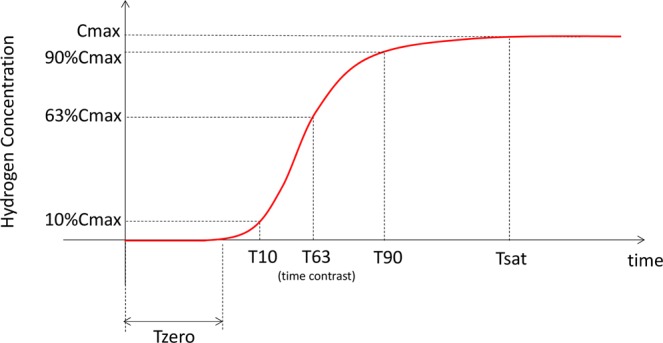
Figure 1.

Definition of hydrogen concentration curve measurements. Important concentration curve measurements were as follows. Cmax - the maximum plateau concentration where the concentration changes were less than 1% of the difference between baseline and maximum concentrations (i.e., saturation) over 1 min. Cmax-adjusted - Cmax values adjusted by microsensor signals obtained before staring the inhalation and used as an in vivo calibration. Tsat - the time between initiation of inhalation and beginning of saturation. T10, T63, and T90 - the time taken to reach 10, 63, and 90% of Cmax-adjusted, respectively. Tzero - the time required for the hydrogen concentration to reach 3% of Cmax-adjusted.
