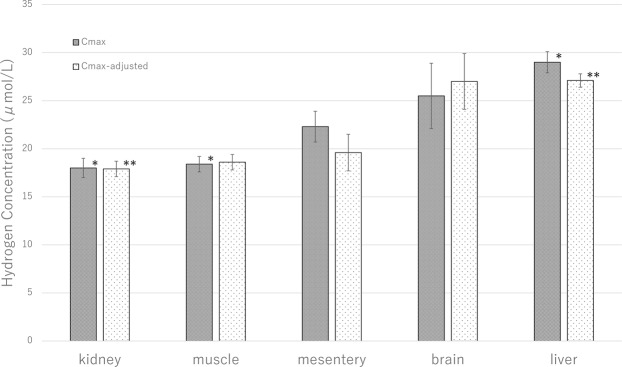
Figure 2.
Maximum hydrogen concentration (Cmax). The liver had the highest mean Cmax while the kidney had the lowest. Although the Cmax varied significantly depending on the organ (P = 0.02 by analysis of variance), the inter-organ comparisons only revealed significant differences between the liver and kidney (*P < 0.05 by unpaired t-test) and liver and muscle (*P < 0.05 by unpaired t-test). Cmax-adjusted was also the highest in the liver and the lowest in the kidney. Cmax-adjusted was significantly different between the liver and kidney (**P = 0.04 by unpaired t-test).

