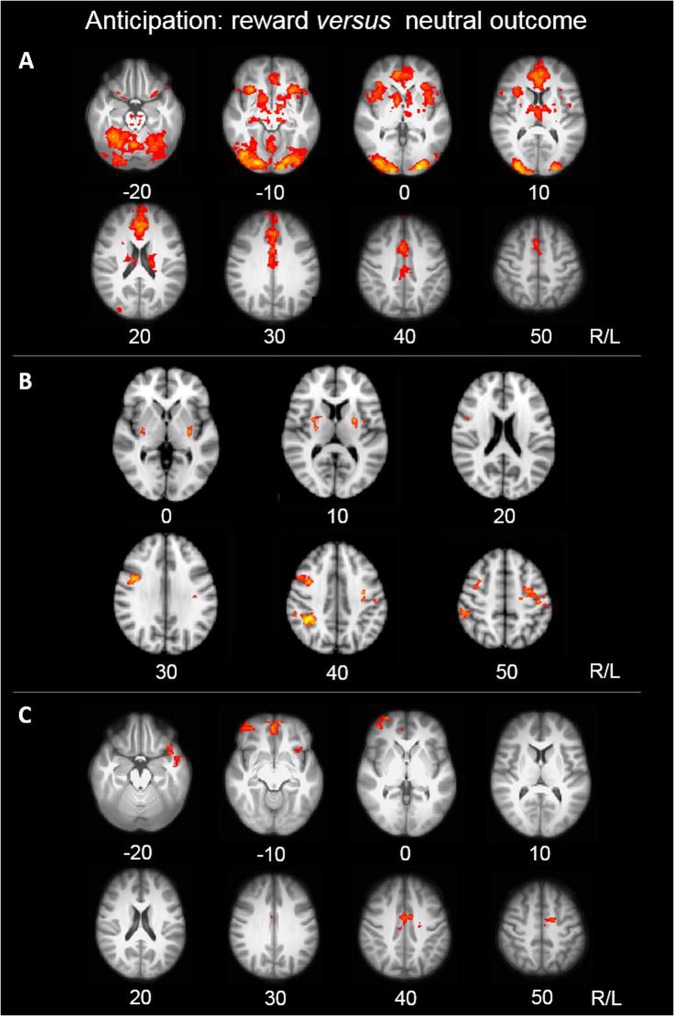
Fig. 3. Brain function during the anticipation of monetary reward versus neutral reward.
Yellow depicts relatively greater changes in activation or functional connectivity. Z-coordinates represented in MNI space. a MID-task activation across all groups. Thresholded statistical map shown (p < 0.00015; FWE corrected for multiple comparisons). b Effect of stimulant drug use on task-related brain activation. Thresholded statistical map showing areas of increased activation in stimulant drug users compared with non-users (p < 0.00015; FWE corrected for multiple comparisons). c Effect of familial risk on putamen functional connectivity to the whole brain. Thresholded statistical map showing areas of altered functional connectivity in familial groups compared with non-familial groups (p < 0.00015; FWE corrected for multiple comparisons)

