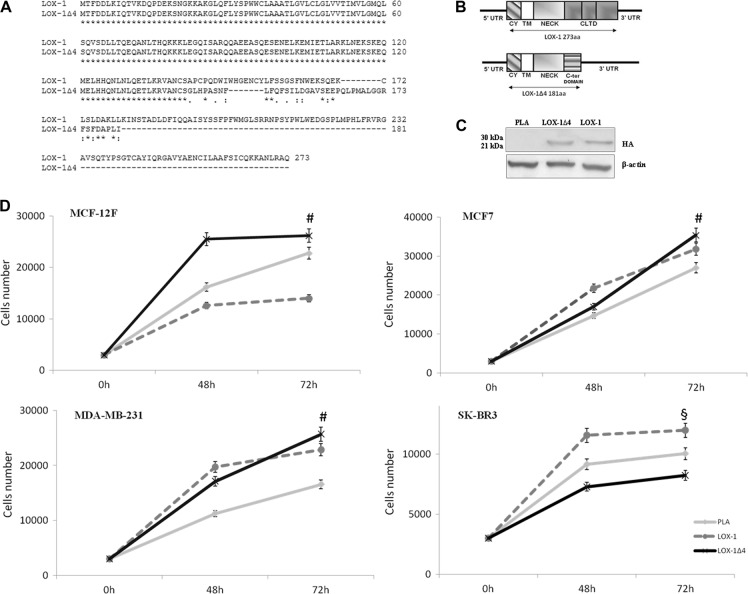
Fig. 4. Effect of LOX-1 isoforms overexpression in breast cancer cell lines.
a Alignment and comparison of aminoacidic sequences of LOX-1 full-length form (NP_002534.1) and LOX-1Δ4 (NP_001166103.1). b Schematic representation of protein products of LOX- 1 and LOX-1Δ4. 5’ UTR, 5’ untranslated region; CY, cytoplasmic domain; TM, transmembrane domain; NECK, neck domain; CLTD, C-terminal lectin type domain; 3’ UTR, 3’ untranslated region. c Western blot analysis of HA-tagged LOX-1 isoforms transfected into MDA-MB-231 cells. d Effects of the overexpression of LOX-1 and LOX-1Δ4 isoforms in breast cancer cell lines. Empty plasmid was used as control (PLA). Values are mean ± SD, and n = 3 (#p < 0.01 PLA vs LOX-1Δ4; §p < 0.05 PLA vs LOX-1)

