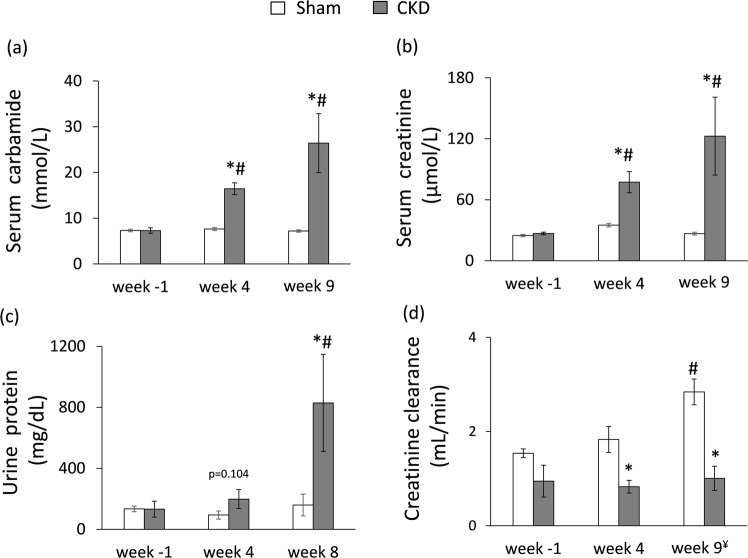
Figure 2.
The development of chronic kidney disease. (a) Serum carbamide level, (b) serum creatinine level, (c) urine protein level (numeric p-value over the bars refers to a comparison between groups within the same time point), (d) creatinine clearance was calculated from urine volume, urine and serum creatinine concentrations according to a formula (urine creatinine concentration [μM] × urine volume for 24 h [mL])/(serum creatinine concentration [μM] × 24 × 60 min). ¥Urine volume and urine creatinine concentration were measured at week 8 and serum creatinine concentration was determined at week 9. White bars represent the sham-operated group and grey bars represent the chronic kidney disease (CKD) group. Values are means ± SEM, n = 9–10, *p < 0.05 vs. sham within the same time point, #p < 0.05 vs. week −1.

