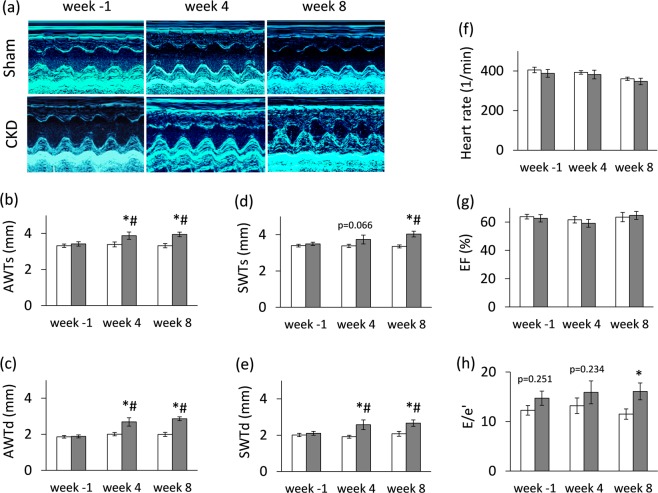
Figure 3.
Echocardiographic results. (a) Representative M-mode images, (b) anterior wall thicknesses in systole (AWTs), (c) anterior wall thicknesses in diastole (AWTd), (d) septal wall thicknesses in systole (SWTs), (e) septal wall thicknesses in diastole (SWTd), (f) heart rate, (g) ejection fraction, (h) E/e′ ratio. White bars represent the sham-operated group, and grey bars represent the chronic kidney disease (CKD) group. Values are means ± SEM, n = 9–10, *p < 0.05 vs. sham within the same time point, #p < 0.05 vs. week -1. (Numeric p-values over the bars refer to the comparison between groups within the same time point)

