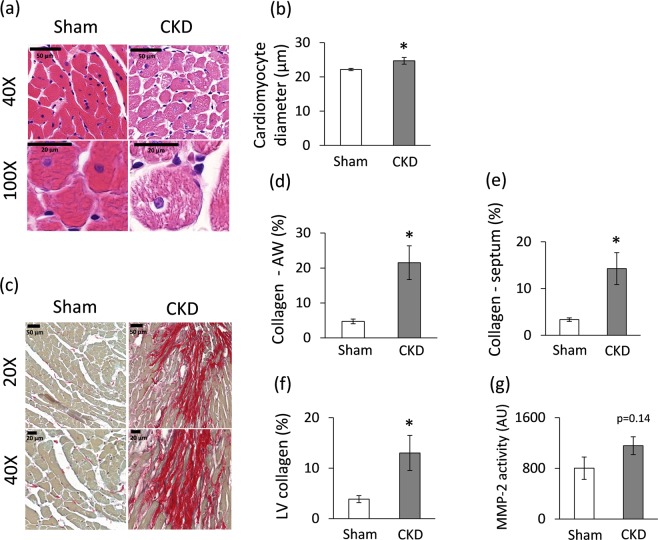
Figure 4.
Histology and zymography results at week 9. (a) Hematoxylin-eosin stained slides, black scale bars represent 50 µm and 20 µm at 40X and 100X magnification, respectively, (b) Cardiomyocyte diameter, (c) Picrosirius red and fast green stained slides, black scale bars represent 50 µm and 20 µm at 20X and 40X magnification, respectively, (d) Anterior wall (AW) collagen content, (e) Septal collagen content (f) Left ventricular (LV) collagen content, (g) MMP-2 activity. White bars represent the sham-operated group, and grey bars represent the chronic kidney disease (CKD) group. Values are means ± SEM, n = 8–9, *p < 0.05, unpaired t-test.

