Figure 5.
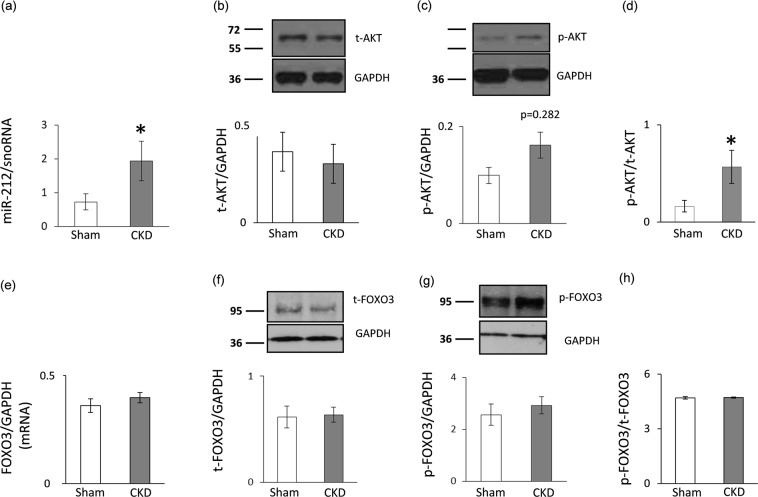
qRT-PCR and Western blot results at week 9. Left ventricular (a) miR-212 expression, (b) total AKT expression, (c) phospho-AKT expression, (d) phospho-AKT/total AKT ratio, (e) FOXO3 mRNA expression, (f) total FOXO3 expression, (g) phospho-FOXO3 expression, and (h) phospho-FOXO3/total FOXO3 ratio. White bars represent the sham-operated group, and grey bars represent the chronic kidney disease (CKD) group. Values are means ± SEM, n = 7–8, *p < 0.05, unpaired t-test (a–e) or Mann-Whitney-U test (f–h).

